
Credit: https://www.visualcapitalist.com/
See the largest greenhouse gas emitters in 2025 and compare cumulative CO₂ and greenhouse gas emissions from the industrial era to 2023.
The answer depends on the period being considered. In 2025, China was the largest annual greenhouse gas emitter, followed by the United States and India. Looking at emissions accumulated since the beginning of industrialisation, the United States has emitted more CO₂ than either China or the European Union. The order of China and the EU changes according to which emissions are included.
This distinction matters. An annual ranking shows emissions in a particular year. A cumulative ranking adds emissions over many years. CO₂-only figures also differ from totals that combine CO₂ with methane, nitrous oxide and other greenhouse gases.
Which countries produced the most emissions in 2025?
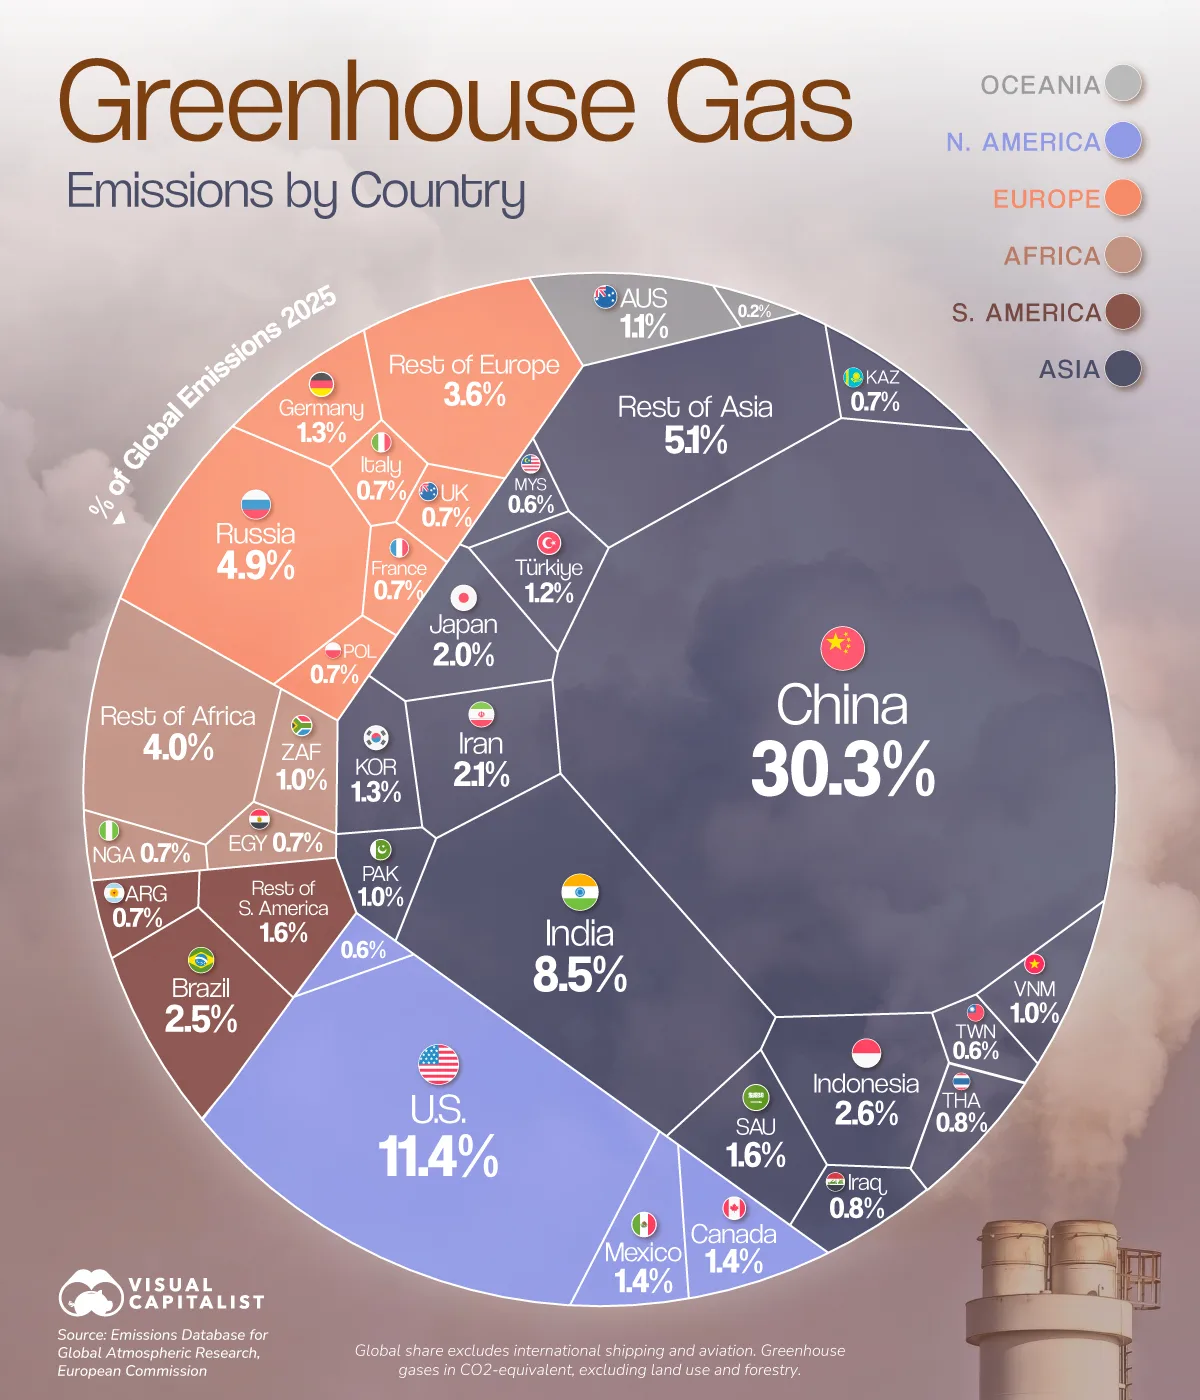
The table below ranks countries by their estimated greenhouse gas emissions in 2025. It uses million metric tonnes of carbon dioxide equivalent (Mt CO₂e). CO₂e is a common unit that expresses the warming effect of different greenhouse gases on a comparable scale.
| Rank | Country | Emissions in 2025 (Mt CO₂e) | Share of global emissions |
|---|---|---|---|
| 1 | China | 15,981 | 30.3% |
| 2 | United States | 6,018 | 11.4% |
| 3 | India | 4,508 | 8.5% |
| 4 | Russia | 2,574 | 4.9% |
| 5 | Indonesia | 1,359 | 2.6% |
| 6 | Brazil | 1,307 | 2.5% |
| 7 | Iran | 1,119 | 2.1% |
| 8 | Japan | 1,063 | 2.0% |
| 9 | Saudi Arabia | 845 | 1.6% |
| 10 | Canada | 765 | 1.4% |
| 11 | Mexico | 717 | 1.4% |
| 12 | South Korea | 696 | 1.3% |
| 13 | Germany | 660 | 1.3% |
| 14 | Türkiye | 611 | 1.2% |
| 15 | Australia | 578 | 1.1% |
The figures and country shares follow the 2025 ranking based on the European Commission’s EDGAR emissions data. The global-share calculation excludes international aviation and shipping.
China’s reported total was about 2.7 times the United States’ total. China, the United States and India together accounted for about 50.2% of the global emissions in this comparison. Adding Russia and Indonesia brings the five largest emitters to about 57.7%.
These are annual totals, not emissions per person. A country with a larger population or industrial economy can produce a larger national total even if its average emissions per person are lower. For example, Canada’s reported total was slightly higher than Mexico’s, but that comparison alone does not show how emissions are distributed among their populations.
What is included in the 2025 greenhouse gas total?
“Carbon emissions” is often used as shorthand for greenhouse gas emissions, but the terms are not identical. CO₂ is the largest contributor to the 2025 total, while methane (CH₄), nitrous oxide (N₂O) and fluorinated gases (F-gases) also contribute. EDGAR reports that fossil CO₂ accounted for 73.8% of global greenhouse gas emissions in 2025, with methane at 17.6%, nitrous oxide at 5.3% and F-gases at 3.3%. edgar.jrc.ec.europa.eu
The ranking uses emissions associated with activity within national territories. It does not reassign emissions to the countries where exported goods are consumed. The EDGAR 2026 report presents 2025 data without land-use, land-use change and forestry (LULUCF) in the country comparison table. International aviation and shipping are reported separately; the shares in the table above exclude them from the global-share denominator.
The European Union is a group of 27 member states, rather than a single country, so it is not included in the country ranking above. Considered as a bloc, the EU-27 emitted about 3.13 billion tonnes of CO₂e in 2025, or 5.78% of the reported global total excluding LULUCF. edgar.jrc.ec.europa.eu
Who has emitted the most since industrialisation in 1850 —the United States, EU or China?
For a historical comparison, 1850 is commonly used as the starting point in long-term emissions datasets. It is a data convention that represents the early industrial era, rather than a precise date when industrialisation began everywhere.
Cumulative CO₂ emissions, including land use
Using historical CO₂ estimates from 1850 to 2023 that include land-use emissions, the ranking is:
| Rank | Region | Cumulative CO₂ emissions, 1850–2023 | Approximate share of the global total |
|---|---|---|---|
| 1 | United States | 471.7 Gt CO₂ | 21% |
| 2 | China | 345.9 Gt CO₂ | 15% |
| 3 | European Union | 311.8 Gt CO₂ | 14% |
One gigatonne (Gt) is one billion tonnes. These estimates come from a 2026 UK Parliament answer based on the PRIMAP-hist historical CO₂ dataset. The figures include emissions from land use, land-use change and forestry. UK Parliament
On this basis, the United States has the largest cumulative CO₂ total, followed by China and then the EU. These are territorial estimates: emissions are assigned to the place where they were produced, including emissions associated with land-use change. They do not allocate emissions from imported products to the countries that bought them.
Why do some sources put the EU ahead of China?
A different comparison counts fossil CO₂ emissions from fuels and industry, without land-use emissions. The Global Carbon Budget estimates that from 1850 to 2023 cumulative fossil CO₂ emissions were approximately:
- United States: 120 Gt of carbon, equivalent to about 440 Gt CO₂
- European Union: 80 Gt of carbon, equivalent to about 293 Gt CO₂
- China: 75 Gt of carbon, equivalent to about 275 Gt CO₂
Under this narrower fossil-and-industry measure, the order is United States, EU, China. When land-use emissions are included, the cited PRIMAP-hist comparison puts China ahead of the EU. The change in order reflects the accounting boundary and the datasets used; it does not mean that one set of figures is automatically wrong. Global Carbon Budget 2024
What if methane and nitrous oxide are included?
A comparison of all greenhouse gases needs a method for expressing different gases on a common scale. One peer-reviewed study assessed historical CO₂, methane and nitrous oxide emissions from 1851 to 2021 and estimated their contributions to global warming. It attributed 17.3% of the combined warming contribution to the United States, 12.3% to China and 10.4% to the EU-27. In that study, the historical order is therefore United States, China, EU. These percentages describe estimated contributions to warming from those three gases; they are not percentages of raw gas mass or a simple share of all greenhouse gases. PMC
This distinction is especially relevant for methane. Methane remains in the atmosphere for a much shorter time than CO₂, so a study’s chosen method for converting methane emissions into CO₂-equivalent terms can affect how historical contributions are compared. The study above uses the GWP* approach for methane and includes CO₂, methane and nitrous oxide, but not F-gases.
What the comparison tells us
The United States ranks first in the cited historical comparisons of cumulative CO₂ and the combined historical warming contribution of CO₂, methane and nitrous oxide. The second-place position depends on the accounting method: China ranks ahead of the EU when historical land-use CO₂ is included and in the study’s three-gas warming comparison; the EU ranks ahead of China in the cited fossil-and-industry-only CO₂ figures.
The annual ranking tells a different part of the story. China is the largest emitter in 2025, while the United States has the largest cumulative historical total among the three. A current annual ranking and a historical cumulative comparison answer different questions, so both are useful when discussing climate responsibility and emissions reduction.
Sources and further reading