
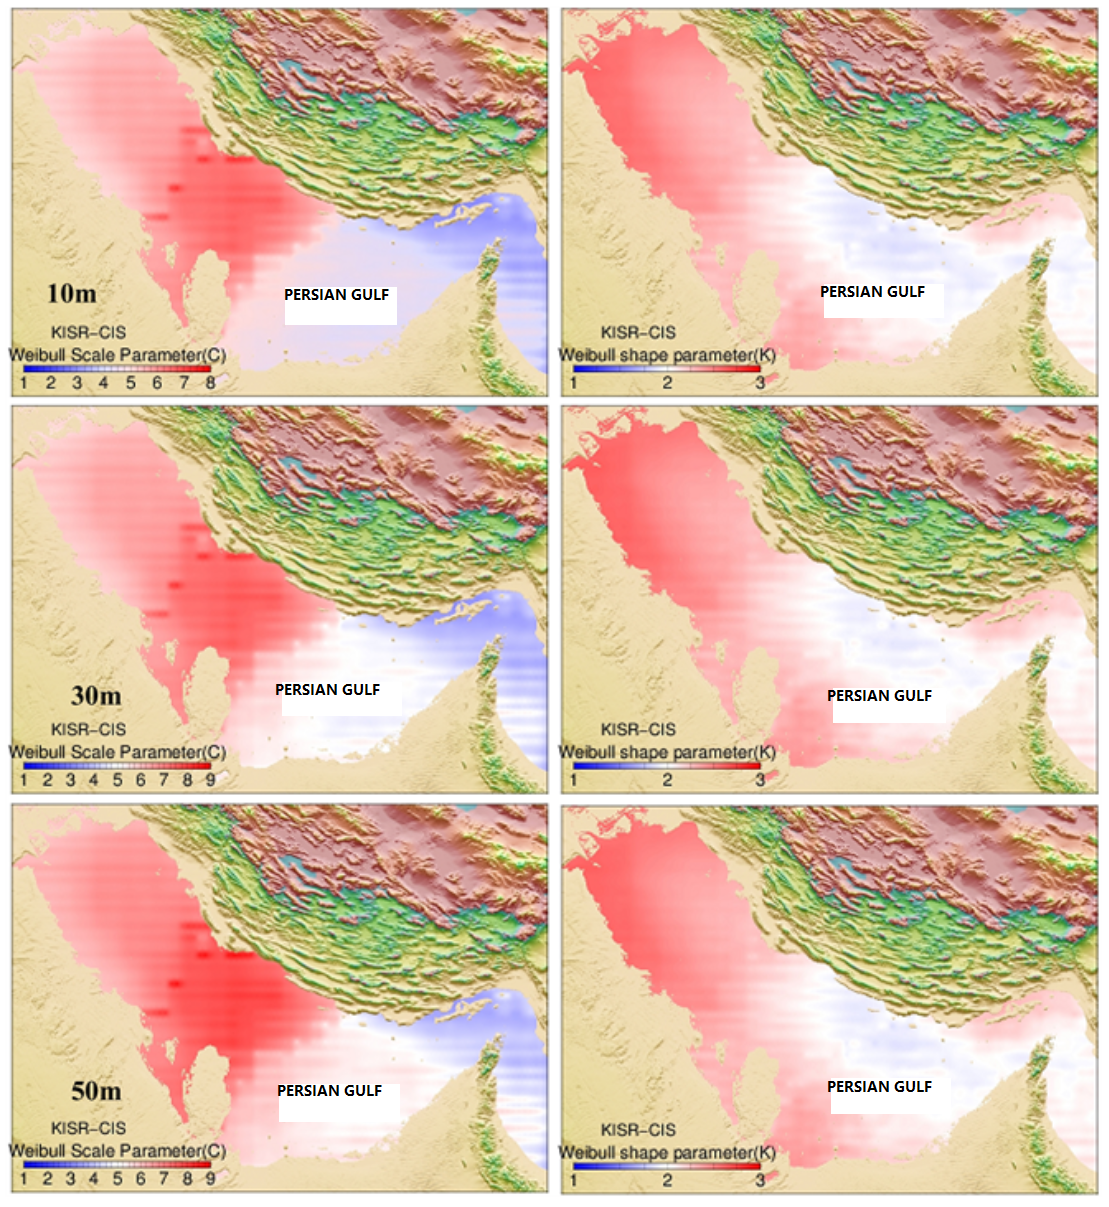
Wind power is not only pollution-free and renewable but is becoming more economical with technology development. The countries around the Persian Gulf region are investing in wind power on both land and in their marine space. A detailed study on wind power resource in the Persian Gulf is not available. This paper is on the wind energy resource availability over Persian Gulf waters, covering 2300 grid points. The data available with Coastal Information System database at Kuwait Institute for Scientific Research, Kuwait, from 1979 to 2015 is used. The probability density and power density were derived from this data source. Weibull probability density function has been fitted to the wind speed data, and the wind power density was evaluated. The study is carried out at 10 m, 30 m, and 50 m elevations. The central location of the Persian Gulf has higher annual average wind speeds, ranging from 6 to 8 m/s at 10 m elevation, 7 to 8 m/s at 30 m elevation, and 8 to 9 m/s at 50 m elevation. The scale parameter “c” at the central location of the Persian Gulf is found to range from 6 – 8 m/s for 10 m elevation, 7 – 8 m/s for 30 m elevation, and 8 – 9 m/s for 50 m above sea level. The Weibull shape parameter k varies from 2.5 to 3 at the north and central of the Persian Gulf. The annual mean wind power density over Persian Gulf Waters is the highest in the central region of the Gulf. The power density at 10 m, 30 m, and 50 m hub height varies between 200 to 300 w/m2, 200 to 300 w/m2, and more than 300 w/m2 respectively. It is attractive to install large-scale wind power generation at the central region of the Persian Gulf and at elevations of 30 m or 50 m, since this region lies in Class 2 category of the Wind Energy Resource Atlas of the United States. The wind power density is attractive especially in the summer season around the central region location in the Persian Gulf (Saudi Arabia, Bahrain, and Qatar), since a high rate of power is used for air conditioning systems in summer.
Keywords : Wind Energy, Persian Gulf, Weibull Distribution, Gulf Cooperation Council, Kuwait
Persian Gulf is one of the promising seas in the Middle East and is located in between Saudi Arabia on its west and Iran on its east (Figure 1). The Persian Gulf is surrounded by Oman, Saudi Arabia, UAE, Qatar, Bahrain, Kuwait, Iraq, and Iran. The Gulf is known for its rich source of oil and gas, which is being very effectively exploited by most of the countries. The gulf has a few islands and there are plenty of large developed cities located on its shores. The water depth of the Persian Gulf is shallow. Water depths of more than 100 m are available only on the Iranian coast.
The countries surrounding the Persian Gulf generate power mainly from hydrocarbons like oil and gas. Though hydrocarbon-based fuel can provide the needed energy in the future, the Gulf Cooperation Council (GCC) Countries have proposed targets for renewable energy (Figure 2).
A study by apricum group (https://www.apricum-group.com/gcc-countries-rising-stars-solar-wind/#_ftn1) reveals that wind power may be cheaper than oil-based power if the real export cost is considered for oil. For example, apricum group revealed that solar and wind power can effectively complement the existing conventional capacity and provide electricity at a low cost of below 10 USD cent/kWh―about half the cost of oil-fired power generation at market prices. In fact, the most recent tender in Dubai has resulted in the remarkable tariff of 6 USD cent/kWh (unsubsidized). So, particularly oil-rich countries such as Saudi Arabia, Kuwait, or the United Arab Emirates (UAE) are better off exporting oil instead of burning it domestically for power generation.
In general, GCC countries have an abundant source of oil and gas, and hence at the beginning, the interest in renewable energy was feeble. However, the increase in the level of air pollution and environmental degradation of fossil fuel burning has created more interest in renewable energy investments (Doukas et al. [1]). Electricity consumption in GCC countries increased rapidly during the last three decades, not only in absolute terms but also in terms of its share in total energy demand. The continued growth in electricity demand will require significant investments over the coming period and will put further strains on government budgets (Al-Faris, [2]). Due to the vast growth of development in the infrastructure and investment in energy, the electricity consumption in the GCC countries had increased at a fast rate (Al-Naser and Al-Naser [3]); 12.4% from 2005 to 2009 (3.15%, annually). This rate is much larger than the world average, which is 2.2% for the same period, or the USA (0.5%). In 2005, the average Watt per person in the GCC countries was 1149, which is much higher than the world average (297 W per person) or the European Union (700 W/person)―but less than the USA (1460 W/person). The GCC countries need to increase their electrical capacity by 60,000 MW, which represents 80% of the current installed capacity, to meet demand in 2015. This means that there is a need to build 50 more gas-fired power generator plants (each rated 1400 MW). Al-Naser and Al-Naser [3]) have also worked out the cost of power production in GCC countries from wind power plants.
Methodology and Analysis
1) Wind Power density function: It is well known that the power of the wind at speed v through a wind turbines blade sweep area (A) increases as the cube of its velocity and can be calculated as follows (Ahmed [16] , Al-Naser [17] ):
P(v)=12ρAv3
(1)
where ρ is the mean air density (1.225 kg/m3 at average atmospheric pressure at sea level and at 15˚C). However, as a consequence of the cubic dependence of power with wind velocity, the mean speed remains an unsuitable measure when assessing the available wind power density.
It is also well known that the statistical behavior of the wind can be approximated by the Weibull distribution function (Weibull [18] , Ramrez [19] and Celik [20] ), which describes the probability, P(w), for a certain wind speed, v, depending on the scale parameter, c, and the shape parameter, k. The expected monthly or annual wind power density per unit area of a site based on a Weibull probability density function can be expressed as follows:
Pw=12ρc3¬[1+3k]
(2)
To following equation is used to calculate the Weibull shape parameter or factor (k) by iteration method (maximum likelihood method):
k=(∑n1vkLn(v)∑n1vk−∑n1Ln(v)n)−1
where c is the Weibull scale parameter (m/s), and is given by:
c=vm¬(1+1k)
(3)
where ¬
the gamma function and “n” is is the total wind data record. Then, Weibull scale parameter is calculated as
c=(∑n1vkn)1k
The two significant parameters k and c are closely related to the mean value of the wind speed vm (Celik [21] ). By extracting c from Equation [3] and k, the power density for the Rayleigh model can be found by (Al-Mohamad [22] ):
PR=3πρc3(π4)32
(4)
Errors in calculating the power densities using the distributions in comparison to values of the probability density distributions derived from measured wind speed values can be found by the following Equation:
Error(%)=PW,R−Pm,RPm,R
(5)
where PW,R
is the mean power density calculated from either the Weibull or Rayleigh function used in the calculation of the error and Pm,R
is the wind power density assessed from the probability density distribution, derived from the measured wind speed values which serves as the reference mean power density.
2) Wind speed variation with height: Since the wind speed data are available at 1 height of 10 m from the ground or mean water level, it is necessary to assess the wind speed at the center of turbine hub, which varies from 30 m to 50 m depends on its capacity. This requires an equation that predicts the wind speed at one height in terms of the measured speed at another height. The most common expression for the variation of wind speed with height is the power law (Perez [23] ) having the following form:
v2v1=[h2h1]∝
(6)
where v1 and v2 are the mean wind speeds at heights h1 and h2, respectively. The exponent ∝
depends on factors such as surface roughness and atmospheric stability as shown in Table 1.
Numerically, it lies in the range 0.0 – 0.5, with the most frequently adopted roughness value being 0.5 with roughness length of 0.0024.
The Equation (6) can be written as follows:
v2v1=ln(h2r)ln(h1r)
(7)
where r is Roughness Length (m), v2 wind speeds at selected elevation from ground level h2.
The wind speed at a certain height above ground level is
v2=v1[ln(h2r)ln(h1r)]
(8)
The fact that the wind profile is twisted towards a lower speed as we move closer to ground level is usually called wind shear. Wind shear may also be important when designing wind turbines.
The information provided in this methodology section is used for assessing the Weibull parameters over the Arabian Gulf and its probability distribution.
| Roughness | Roughness Length (m) | Energy Index (%) | Landscape Type |
|---|---|---|---|
| 0 | 0.0002 | 100 | Water surface (Persian Gulf) |
| 0.5 | 0.0024 | 73 | Completely open terrain with a smooth surface, e.g. concrete runways in airports, mowed grass, etc. |
| 1 | 0.03 | 52 | Open agricultural area without fences and hedgerows and very scattered buildings. Only softly rounded hills |
| 1.5 | 0.055 | 45 | Agricultural land with some houses and 8 meter tall sheltering hedgerows with a distance of approx. 1250 meters |
| 2 | 0.1 | 39 | Agricultural land with some houses and 8 meter tall sheltering hedgerows with a distance of approx. 500 meters |
| 2.5 | 0.2 | 31 | Agricultural land with many houses, shrubs and plants, or 8 meter tall sheltering hedgerows with a distance of approx. 250 meters |
| 3 | 0.4 | 24 | Villages, small towns, agricultural land with many or tall sheltering hedgerows, forests and very rough and uneven terrain |
| 3.5 | 0.8 | 18 | Larger cities with tall buildings |
Results and Discussions
Data for wind speed used in the present calculations were obtained for the period 1979-2015 from the Coastal Information System Database at KISR (Al-Salem [24] [25] and Rakha [26]). The wind data used were numerically predicted and are validated with the instrumentally measured wind speed data from Kuwait International Airport data (Al-Salem [27]). All the locations in the study were positioned over Persian Gulf waters in open spaces free of obstacles at a height of 10 m above the ground. Wind speeds stored and averaged over one hour in the database. The wind speed changes with height because air pressure is low at higher elevations and the air which gets heated from the surface of the earth also moves to higher altitude. This air provides energy to the air speed at higher elevation. In this study, 3 different heights at 10, 30, and 50 m from the sea level are used to calculate the mean wind speed maps over Persian Gulf waters for a period of 1979-2015 as shown in Figure 3. The results obtained from the wind speed study can be summarized as follows:
§ The central area of the Persian Gulf has higher wind speed ranging from 6 – 8 m/s at 10 m elevation, 7 – 8 m/s for 30 m elevation, and 8 – 9 m/s for 50 m elevation.
§ The northern area of the Persian Gulf has moderate wind speed ranging from 3 – 4 at 10 m elevation, 4 – 5 m/s for 30 m elevation, and 5 – 6 m/s for 50 m elevation.
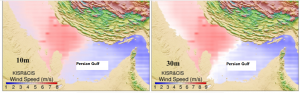
Mean wind speed (m/s) at 10, 30, and 50 m above sea level over Persian Gulf waters for periods of 1979-2015.
§ The southern area of the Persian Gulf has low wind speed ranging from 2.5 – 3.0 m/s for 10 m elevation, 3 – 4 m/s for 30 m elevation, and 4 – 4.5 m/s for 50 m elevation.
Hence it is clear that the central area of the Persian Gulf is attractive for extracting wind energy.
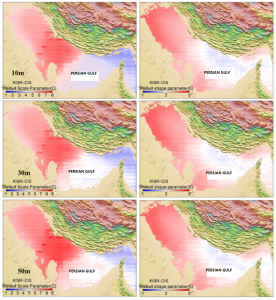
Weibull shape function k and scale factor c for wind speed data at 10, 30 and 50 m above sea level over Arabian Gulf waters for periods of 1979-2015.
Assessment of Wind Power Density Potential at G.C.C Countries
The interest in renewable energy in the GCC countries has been on the rise in recent years. With the region’s consumption expected to continue growing at a fast pace over the next two decades, renewable energy has become an important consideration in government strategies to diversify the domestic energy mix. Renewable energy could also help mitigate the natural gas shortages GCC economies could experience over the coming decades. In Kuwait, Saudi Arabia, and the UAE, local production has already been outstripped by domestic market consumption. To examine the wind power potential of the GCC countries over their territorial waters in the Persian Gulf, Table 4 is provided.
・ Countries, which are located at the central zone of Persian Gulf waters (such as Saudi Arabia, Bahrain, and Qatar) have annual wind power of 277, 300, 275 w/m2, respectively. This order of wind power is attractive for large-scale power production, lying in Class 2 of the US wind power density classification (Elliott [28]).
・ Countries located at the South zone of Persian Gulf waters (United Arab Emirate) have annual wind power of 120 w/m2, which is low for economic large-scale power production.
・ Countries located at the north zone of Persian Gulf waters (Kuwait) have annual wind power of 166 w/m2, which is acceptable for economical medium-scale power production.
It is important to compare the probability distribution of the wind power assessed based on the data and derived from Weibull distribution to assess how good Weibull distribution is for the present study. Figure 8 shows such a plot. It is found that the prediction by Weibull distribution compares satisfactorily with the estimate of the actual data for the locations indicated in Table below.
Conclusions
The potential of wind energy resources over Persian Gulf waters, covering 2300 grid points is carried out using data available with Coastal Information System
| G.C.C. Countries | Map Location | Mean Annual WPD (w/m²) | Total Annual Energy (8760 hr) (w/m²) |
|---|---|---|---|
| Kuwait | E48°18’0.0″ | 166 | 1454 |
| N29°12’0.0″ | |||
| Saudi Arabia | E50°30’0.0″ | 277 | 2426 |
| N26°36’0.0″ | |||
| Bahrain | E50°28’0.0″ | 300 | 2628 |
| N26°18’0.0″ | |||
| Qatar | E51°18’0.0″ | 275 | 2409 |
| N26°12’0 |
Mean wind power densities (w/m²) for the period of 1979-2015 over Persian Gulf waters at a hub height of 30 m above sea level for GCC countries.