

09/11/2025
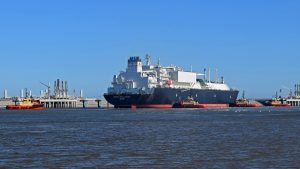
U.S. liquefied natural gas (LNG) exports have experienced notable volatility in recent weeks, with a measurable decline in export volumes attributed to a combination of operational disruptions at major facilities and shifting global market conditions. Weekly data shows an 8.5% decrease in gas deliveries to export terminals, falling to 456 million cubic meters per day. The broader context, however, reveals a more complex picture. The United States remains the world’s largest LNG exporter, having achieved record-breaking monthly exports as recently as August 2025, when shipments reached 9.33 million metric tons. This report provides a comprehensive analysis of current export trends, facility-specific challenges, market dynamics, and the strategic outlook for the U.S. LNG sector, incorporating the latest available data through early September 2025.
Recent Export Performance Trends
Weekly Export Volatility
During the week ending September 3, 2025, U.S. LNG exports experienced a noticeable contraction. Shipments from liquefaction terminals totaled 26 cargoes, compared to 28 the previous week, representing a decrease of approximately 7.1% in vessel movements. In volumetric terms, this translated to approximately 2.83 billion cubic meters (bcm) of LNG exported, down from 3 bcm the week before, reflecting a 5.7% week-over-week decline.
The reduction in LNG exports was directly mirrored in decreased natural gas deliveries to export terminals. Data from the Energy Information Administration indicates that feedgas demand fell by approximately 8.5 million cubic meters per day, to a total of 456 million cubic meters daily. This decline highlights the direct correlation between feedgas availability and LNG export volumes.
Regional Disparities
The export decline was not uniformly distributed across all LNG exporting regions. The most significant reduction was recorded in South Texas, where deliveries to export terminals decreased by 5.9% or approximately 5.7 million cubic meters per day. This substantial drop was largely attributed to operational issues at facilities in the region, particularly Freeport LNG.
Meanwhile, South Louisiana witnessed a more modest decline of 0.5%, suggesting relatively stable operations at facilities in this region despite the broader market downturn. Terminals located outside the Gulf of Mexico maintained a steady flow of approximately 31 million cubic meters per day, demonstrating more resilient operations in areas less susceptible to the weather-related disruptions that often plague Gulf Coast facilities.
Key LNG Export Facility Analysis
Major Facility Performance
Table: U.S. LNG Export Facility Performance (Week Ending September 3, 2025)
| Facility Name | Location | Cargoes Shipped | Capacity Utilization | Notable Status |
|---|---|---|---|---|
| Sabine Pass | Louisiana | 8 | Approximately 82% | Minor maintenance |
| Plaquemines | Louisiana | 5 | 77% | Ramping up |
| Corpus Christi | Texas | 4 | ~70% | Technical issues |
| Freeport LNG | Texas | 4 | ~60% | Operational volatility |
| Cameron LNG | Louisiana | 3 | ~65% | Reduced feedgas |
| Calcasieu Pass | Louisiana | 2 | ~40% | Arbitration impacts |
| Cove Point | Maryland | 0 | 0% | Maintenance |
| Elba Island | Georgia | 0 | 0% | Unknown |
Facility-Specific Challenges
Freeport LNG has experienced significant operational volatility throughout 2025, with multiple disruptions including power outages, lightning strikes, and hurricane-related shutdowns. These incidents have reduced U.S. LNG exports by an estimated 21.5% during disruption periods and contributed substantially to natural gas price volatility. The facility’s susceptibility to weather events and technical issues has exposed broader vulnerabilities in U.S. LNG infrastructure.
Sabine Pass, the largest LNG export plant in the United States, has maintained relatively stable operations, though it recently underwent planned maintenance that temporarily affected output. Despite its generally reliable performance, Sabine Pass recorded a decline in gas demand to 3.7 billion cubic feet per day in mid-August, down from its capacity of 4.5 bcfd, indicating some operational challenges.
Venture Global’s Plaquemines facility has been a growth engine for U.S. LNG exports, with its production ramp-up contributing significantly to overall volumes. The facility reached 77% of its capacity in the second quarter of 2025, with 28 of its 36 trains operational. This ramp-up has helped offset declines at other facilities, with Plaquemines alone accounting for more than 95% of global LNG supply growth in Q1 2025.
Market Dynamics and Demand Factors
Global Demand Patterns
Europe continues to be the predominant destination for U.S. LNG exports, receiving 66% of total shipments (6.16 million tons) in August 2025. This represents an increase from 58% in July, indicating strengthening European demand as the continent continues to seek alternatives to Russian pipeline gas.
Exports to Asia declined slightly in August to 1.47 million tons, down from 1.8 million tons in July. This reduction reflected narrowing price arbitrage opportunities between Asian and European markets, with the Japan Korea Marker (JKM) benchmark falling to $11.63 per mmBtu from $12.18 in July. The muted Asian demand has reduced competition for Atlantic Basin LNG cargoes, allowing European buyers to secure volumes at relatively favorable prices.
Price Dynamics and Arbitrage
U.S. natural gas prices have experienced volatility, recently falling 3% to a one-week low due to decreased LNG feedgas demand. Front-month gas futures for October delivery on the New York Mercantile Exchange dropped to $3.132 per million British thermal units (MMBtu), reflecting the delicate balance between domestic supply and export demand.
The narrowing spread between European (TTF) and Asian (JKM) benchmark prices has reduced the arbitrage opportunities that often drive LNG trading patterns. With TTF prices at $11.13/mmBtu and JKM at $11.63/mmBtu in August, the minimal difference has made transatlantic shipments to Europe more economically attractive than longer voyages to Asia.
Financial Performance and Strategic Developments
Major Operator Financials
Cheniere Energy reported strong financial results for the second quarter of 2025, with revenues of $4.6 billion and net income of $1.6 billion. The company raised and tightened its full-year 2025 guidance, now expecting Distributable Cash Flow of $4.4–$4.8 billion, reflecting confidence in its operational outlook despite market volatility.
Venture Global reported quarterly revenue of $3.1 billion, exceeding analyst expectations. The company’s adjusted EBITDA of $1.39 billion for Q2 2025 beat Wall Street projections of $1.25 billion, driven primarily by the ramp-up of its Plaquemines facility.
Strategic Expansion and Investment
Cheniere made a positive Final Investment Decision (FID) for its CCL Midscale Trains 8 & 9 Project and continues to develop the Sabine Pass Stage 5 Expansion Project, which could add up to 20 mtpa of additional capacity through three new liquefaction trains. These projects represent significant commitments to expanding U.S. LNG export capability despite short-term market fluctuations.
Venture Global continues to ramp up its Plaquemines facility, which broke the 2 bcf/d feedgas threshold recently. To put this achievement in perspective, this volume exceeds Russia’s current piped gas supplies to the European Union via TurkStream, highlighting the strategic importance of U.S. LNG in global energy security.
Future Outlook and Challenges
Expansion Projects and Capacity Growth
Table: Selected U.S. LNG Expansion Projects (Status as of September 2025)
| Project Name | Developer | Planned Capacity | Current Status | Expected Completion |
|---|---|---|---|---|
| SPL Expansion Project | Cheniere | ~20 mtpa | FERC application filed | Phase 1: 2028–2029 |
| CCL Midscale Trains 8&9 | Cheniere | ~12 mtpa | FID positive, construction started | 2028 |
| Freeport Train 4 | Freeport LNG | ~6 mtpa | Planned | Unknown |
| Plaquemines Phase 2 | Venture Global | ~20 mtpa | Under construction | 2026–2027 |
Persistent Challenges
The U.S. LNG sector continues to grapple with operational vulnerabilities, particularly weather-related disruptions along the Gulf Coast. Freeport LNG’s extensive downtime throughout 2025 exemplifies this challenge, with incidents ranging from hurricane shutdowns to power outages significantly affecting export volumes.
Developers also face regulatory hurdles and market uncertainties that could impact future expansion plans. Cheniere’s Sabine Pass Expansion Project requires ongoing engagement with the Federal Energy Regulatory Commission (FERC), with the company having filed an amended application in June 2025. The outcome of these regulatory processes will significantly influence the trajectory of U.S. LNG export growth in the latter half of the decade.
Venture Global faces significant financial exposure from ongoing contract arbitration disputes with several global energy majors, including BP, Shell, and Repsol. The company estimates a potential penalty of up to $1.6 billion if it loses these cases, which revolve around allegations that Venture Global delayed the commercial startup of its Calcasieu Pass plant to benefit from higher spot market prices. A decision in one of these proceedings is expected imminently, potentially setting a precedent for similar disputes across the industry.
Conclusion
The recent decline in U.S. LNG exports reflects short-term operational challenges rather than a structural downturn in the sector. While weekly data shows concerning reductions, particularly in South Texas where Freeport LNG continues to face operational volatility, the broader context reveals a more resilient industry. The United States maintains its position as the global LNG export leader, with record monthly volumes achieved as recently as August 2025.
The fundamental drivers of U.S. LNG competitiveness remain intact: abundant natural gas resources, extensive infrastructure investments, and strategic geographic positioning to supply both European and Asian markets. Major operators like Cheniere and Venture Global continue to report strong financial performance and are moving forward with substantial expansion projects that will increase capacity through the late 2020s.
However, the sector must address persistent challenges related to operational reliability, regulatory approvals, and market uncertainties. The concentration of export capacity along the hurricane-prone Gulf Coast creates inherent vulnerabilities, as demonstrated by Freeport LNG’s extensive downtime throughout 2025. Additionally, arbitration cases and changing market dynamics could impact future investment decisions.
Looking forward, U.S. LNG exports are poised for continued growth, but with increased volatility and operational complexity. The industry must balance expansion ambitions with resilience investments to mitigate weather-related risks and operational disruptions. As global demand for natural gas continues to evolve, particularly in Europe and emerging Asian markets, the United States remains strategically positioned to play a leading role in global LNG markets, though the path forward may be characterized by increased volatility and competitive pressures.
References
-
Bortuzzo, L., et al. (2025). U.S. LNG market resilience and infrastructure vulnerabilities.
-
DNV. (2024). Global LNG Outlook Report.
-
Energy Information Administration (EIA). (2025). Weekly Natural Gas Storage and LNG Exports Data.
-
Lloyd’s Register & Arup. (2024). Operational Risks in Global LNG Facilities.
-
Rau, G. H. (2011). LNG operations and climate impacts.
-
Venture Global LNG. (2025). Quarterly Financial Results Q2 2025.
-
Cheniere Energy. (2025). Investor Relations: Q2 2025 Earnings Report.