
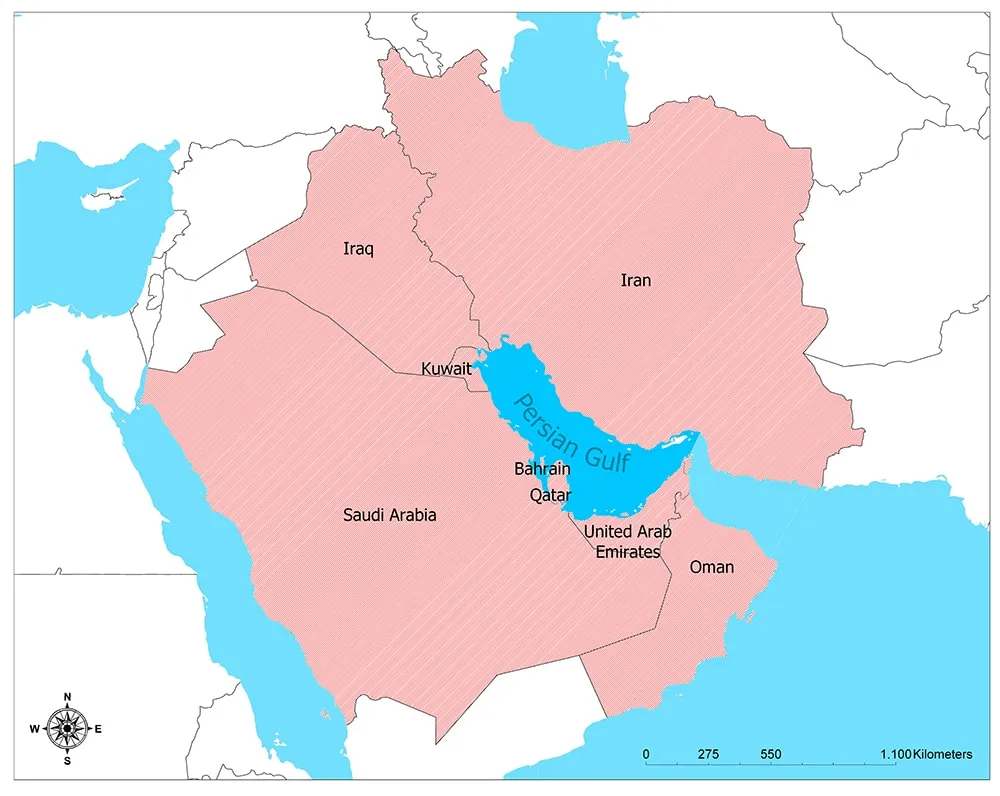
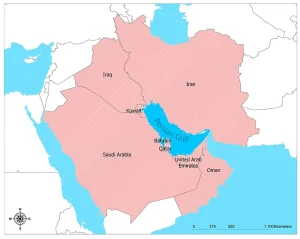
The Persian Gulf is the epicenter of global energy supply, home to nearly 50% of the world’s proven oil reserves and 40% of its natural gas reserves. For nations like Saudi Arabia, Iran, Iraq, Kuwait, the UAE, Qatar, and Bahrain, hydrocarbon exports form the backbone of their economies. This article examines how these countries’ GDP, employment, trade balances, and geopolitical influence are deeply intertwined with oil and gas production—and what challenges and opportunities lie ahead.
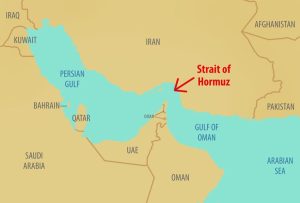
The Strait of Hormuz connects the Persian Gulf to the Gulf of Oman, effectively linking it to the rest of the world. This narrow waterway is a crucial chokepoint for global oil and natural gas shipments, particularly those originating from the Middle East.
Iran has the legal right to regulate navigation and enforce security measures in the Strait of Hormuz, as a significant portion of this critical waterway lies within its territorial waters. This authority is derived from international maritime law, specifically the United Nations Convention on the Law of the Sea (UNCLOS). Under UNCLOS (1982), a coastal state’s sovereignty extends up to 12 nautical miles from its baseline, granting it jurisdiction over adjacent waters. Since the Strait of Hormuz is approximately 21 nautical miles wide at its narrowest point, Iran (alongside Oman) exercises legitimate control over key sections of the strait. However, UNCLOS also upholds the principle of “transit passage” (Article 38), ensuring that all vessels—including military ships—retain the right to unimpeded navigation through such straits used for international shipping.
Why Persian Gulf Oil & Gas Dominance Matters
The economies of all eight Persian Gulf nations (Saudi Arabia, Iran, Iraq, Kuwait, UAE, Qatar, Bahrain, and Oman) are heavily dependent on hydrocarbons, though the degree varies. Most are rentier states, meaning they rely on oil/gas exports rather than taxation for government budgets.
Saudi Arabia
-
Oil Contribution to GDP: ~42% (World Bank 2023)
-
Oil Share of Exports: ~90% (SAMA 2023)
-
Government Revenue from Oil: ~80% (IMF 2023)
-
Key Insight: Despite diversification efforts (Vision 2030), oil remains the backbone of the economy.
Iran
-
Oil & Gas Contribution to GDP: ~30% (Central Bank of Iran 2023)
-
Oil Share of Exports: ~70% (despite U.S. sanctions)
-
Government Revenue from Oil: ~50% (IMF 2023)
-
Key Insight: Sanctions have forced Iran to rely more on gas exports and non-oil trade with China.
Iraq
-
Oil Contribution to GDP: ~50% (World Bank 2023)
-
Oil Share of Exports: ~95% (OPEC 2023)
-
Government Revenue from Oil: ~90% (IMF 2023)
-
Key Insight: Post-war recovery still hinges on oil, with limited economic diversification.
Kuwait
-
Oil Contribution to GDP: ~60% (IMF 2023)
-
Oil Share of Exports: ~92% (KPC 2023)
-
Government Revenue from Oil: ~85%
-
Key Insight: Heavy reliance on oil, but sovereign wealth fund (KIA) provides financial cushion.
United Arab Emirates (UAE)
-
Oil Contribution to GDP: ~30% (Abu Dhabi: ~50%, Dubai: ~5%)
-
Oil Share of Exports: ~40% (ADNOC 2023)
-
Government Revenue from Oil: ~60% (mostly Abu Dhabi)
-
Key Insight: Dubai has diversified into tourism & finance, but Abu Dhabi still relies on oil.
Qatar
-
Oil & Gas Contribution to GDP: ~50% (QNB 2023)
-
LNG Share of Exports: ~80% (QatarEnergy 2023)
-
Government Revenue from Oil/Gas: ~80%
-
Key Insight: World’s top LNG exporter; gas is more crucial than oil.
Bahrain
-
Oil Contribution to GDP: ~20% (Bahrain EDB 2023)
-
Oil Share of Exports: ~70%
-
Government Revenue from Oil: ~75%
-
Key Insight: Smallest oil reserves in the Gulf; relies on Saudi support (via Abu Safa field).
Oman
-
Oil & Gas Contribution to GDP: ~35% (NCSI 2023)
-
Oil Share of Exports: ~60%
-
Government Revenue from Oil/Gas: ~70%
-
Key Insight: Unlike GCC neighbors, Oman lacks a large sovereign wealth fund, making it more vulnerable to oil price swings.
Comparative Summary (Table)
| Country | Oil/Gas % of GDP | % of Exports | % of Gov. Revenue | Key Economic Risk |
|---|---|---|---|---|
| Saudi Arabia | ~42% | ~90% | ~80% | Slow diversification |
| Iran | ~30% | ~70% | ~50% | Sanctions limit exports |
| Iraq | ~50% | ~95% | ~90% | Political instability |
| Kuwait | ~60% | ~92% | ~85% | Over-reliance on oil |
| UAE | ~30% (varies by emirate) | ~40% | ~60% (mostly Abu Dhabi) | Dubai diversified, Abu Dhabi still oil-reliant |
| Qatar | ~50% | ~80% (LNG) | ~80% | Gas demand fluctuations |
| Bahrain | ~20% | ~70% | ~75% | Limited reserves, needs Saudi support |
| Oman | ~35% | ~60% | ~70% | No large sovereign wealth fund |
(Sources: IMF, World Bank, OPEC, national oil companies, central banks)
Oil & Gas Resources in the Persian Gulf: The World’s Energy Powerhouse
The Persian Gulf holds unparalleled significance in global energy markets, containing approximately 50% of the world’s proven oil reserves and 40% of its natural gas reserves. This region is the backbone of hydrocarbon supply, with its vast onshore and offshore fields fueling economies from Asia to Europe and North America. The Gulf’s shallow waters and favorable geology make extraction highly cost-effective, with some fields producing oil at less than $5 per barrel. Key players like Saudi Arabia, Iran, Iraq, Kuwait, the UAE, and Qatar dominate production, leveraging their massive reserves to influence global oil prices through OPEC+ policies. The Strait of Hormuz, a critical maritime chokepoint, sees 21 million barrels of oil daily, underscoring the Gulf’s geopolitical and economic importance. However, reliance on fossil fuels poses long-term challenges, including price volatility, environmental concerns, and the need for economic diversification as renewable energy gains traction.
Top 14 Oil & Gas Fields in the Persian Gulf
| Rank | Field Name | Country | Type | Estimated Reserves | Daily Production (Approx.) | Key Operator |
|---|---|---|---|---|---|---|
| 1 | Ghawar | Saudi Arabia | Oil | 58–75 billion barrels | 3.8 million bpd | Saudi Aramco |
| 2 | South Pars | Iran/Qatar | Gas | 1,800 TCF gas | 20+ billion cu ft/day | NIOC / QP |
| 3 | Burgan | Kuwait | Oil | 66–72 billion barrels | 1.7 million bpd | KPC |
| 4 | Safaniya | Saudi Arabia | Offshore Oil | 37 billion barrels | 1.2 million bpd | Saudi Aramco |
| 5 | Rumaila | Iraq | Oil | 17–20 billion barrels | 1.4 million bpd | BP / CNPC |
| 6 | Zakum | UAE | Offshore Oil | 50 billion barrels | 750,000 bpd | ADNOC |
| 7 | Ahvaz | Iran | Oil | 30+ billion barrels | 700,000 bpd | NIOC |
| 8 | Manifa | Saudi Arabia | Offshore Oil | 11 billion barrels | 900,000 bpd | Saudi Aramco |
| 9 | West Qurna | Iraq | Oil | 21 billion barrels | 500,000 bpd | ExxonMobil / Lukoil |
| 10 | Marjan | Saudi Arabia | Offshore Oil | 13 billion barrels | 500,000 bpd | Saudi Aramco |
| 11 | North Field | Qatar | Gas | 900+ TCF gas | 77 million tonnes LNG/year | QatarEnergy |
| 12 | Khurais | Saudi Arabia | Oil | 20 billion barrels | 1.2 million bpd | Saudi Aramco |
| 13 | Azadegan | Iran | Oil | 33 billion barrels | 320,000 bpd | NIOC / CNPC |
| 14 | Bab | UAE | Oil | 7 billion barrels | 400,000 bpd | ADNOC |
(Sources: OPEC, EIA, Saudi Aramco, QatarEnergy, BP Statistical Review 2023)
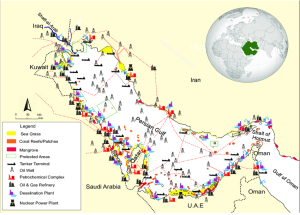
Credit: DOI:10.1016/j.heliyon.2021.e06288 , Major environmentally sensitive areas of the Persian Gulf (Sheppard et al., 2010), main oil and gas infrastructures (International Energy Agency, https://www.iea.org), major ports (Ardemagni 2018), desalination plants (Dawoud 2012) and nuclear energy facilities (World Nuclear Association 2019).
–
Geopolitical & Maritime Implications
1. Strait of Hormuz: The World’s Most Critical Oil Chokepoint
The Strait of Hormuz is the world’s most vital oil transit route, with 21 million barrels per day (a third of global seaborne oil) passing through its narrow waters. Any disruption—whether from geopolitical tensions, military conflict, or sabotage—could trigger an immediate oil price surge, destabilizing global energy markets. Iran’s repeated threats to block the strait in response to sanctions add further volatility, making it a persistent risk for Gulf economies and international trade (EIA, 2023).
- 21 million barrels/day (⅓ of global seaborne oil) pass through this narrow waterway.
- Tensions with Iran threaten supply chains, impacting global oil prices.
2. OPEC’s Influence on Global Markets
Gulf nations, particularly Saudi Arabia, the UAE, Kuwait, Iran, and Iraq, dominate OPEC’s decision-making. Their production adjustments—such as the 2023 supply cuts—directly impact global oil prices. With Europe and Asia heavily reliant on Gulf oil, OPEC’s policies can either stabilize or disrupt economies worldwide, reinforcing the region’s geopolitical leverage (IMF, 2023).
- Gulf nations (Saudi Arabia, UAE, Kuwait, Iran, Iraq) dominate OPEC decisions.
- Production cuts or increases directly affect oil prices worldwide.
3. Sanctions & Economic Resilience
Despite U.S. sanctions, Iran continues exporting oil through covert maritime routes to China, bypassing Western restrictions. Meanwhile, Russia’s 2022 invasion of Ukraine boosted Gulf oil demand as Europe sought alternatives to Russian energy. This shift underscored the Gulf’s role as a critical energy supplier, even amid global sanctions and conflicts (Reuters, 2023).
- Iran’s economy suffers under U.S. sanctions but still exports oil to China via covert maritime routes.
- Russia’s 2022 invasion of Ukraine increased Gulf oil demand as Europe sought alternatives.
–
Challenges & Future Diversification Efforts
1. Vulnerability to Oil Price Shocks
The 2014 oil price crash exposed the Gulf’s dependence on hydrocarbons, prompting fiscal reforms like VAT introduction (Saudi Arabia, UAE). To mitigate future risks, nations are investing in renewables—such as Saudi’s NEOM and UAE’s Masdar City—to transition toward sustainable energy (World Bank, 2023).
2. Environmental & Sustainability Pressures
The IMO 2020 sulfur cap forced Gulf refiners to produce cleaner marine fuels, while COP28 (hosted by the UAE in 2023) highlighted the region’s balancing act between oil production and green energy commitments. These pressures are accelerating investments in carbon-neutral technologies (IEA, 2023).
3. Economic Diversification Strategies
Gulf nations are aggressively diversifying beyond oil. Saudi Vision 2030 focuses on tourism (Red Sea Project), tech, and manufacturing, while the UAE’s Dubai Model prioritizes finance, logistics, and mega-events like Expo 2020. These efforts aim to build resilient, post-oil economies (IMF, 2023).
–
FAQ Section
Q1: Which Persian Gulf country is least dependent on oil?
-
Bahrain has diversified into banking and tourism, with oil contributing ~20% of GDP.
Q2: How does the Strait of Hormuz impact global trade?
-
Any blockade could spike oil prices by 50%+, disrupting supply chains (U.S. EIA).
Q3: Are Gulf nations investing in renewables?
-
Yes, Saudi Arabia plans 50% renewable energy by 2030, and UAE leads in solar (Mohammed bin Rashid Solar Park).
–
Conclusion
The Persian Gulf’s economies remain deeply tied to oil and gas, but diversification efforts are underway. While hydrocarbons will dominate for decades, sustainability pressures and market volatility are pushing Gulf nations toward tech, tourism, and green energy. For maritime professionals, understanding these dynamics is crucial for navigating future trade and regulatory shifts.
Wonderful blog! I found it while browsing on Yahoo News.