
06/12/2025
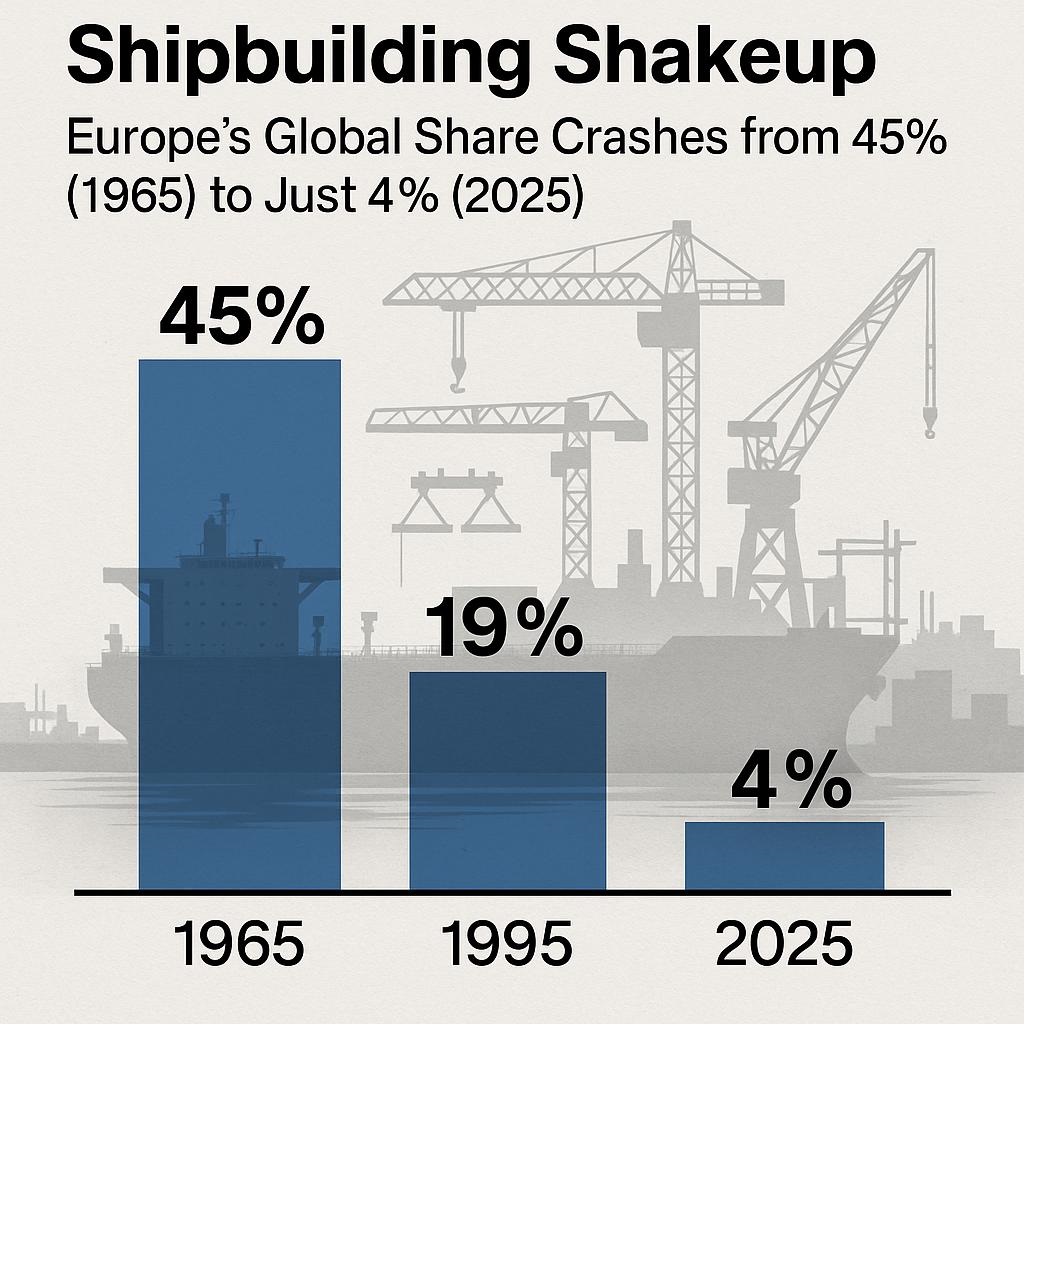
Over the past 60 years, the global shipbuilding industry has undergone a dramatic metamorphosis. Once a European stronghold, the landscape now finds the continent relegated to a minor role as Asia emerges as the undisputed epicenter. This shift is underscored by recent data from Clarkson Research, showcased during Nor‑Shipping 2025, highlighting a sharp decrease in European share—from nearly half of world production in 1965 to a mere 4% in 2025.
Meanwhile, China alone commands more than half of global output. Adding nuance to the narrative, recent fluctuations in new-built orders and major investment in green technologies signal the sector is in the midst of a strategic recalibration. This in‑depth article explores the historical arc, present dynamics, and future direction of global shipbuilding.
Europe’s Six-Decade Decline
In 1965, European shipyards accounted for roughly 45% of global production by gross tonnage (GT), drawing ahead of Japan (44%) and dwarfing the United States (2%)—a testament to the continent’s industrial might.
Why did Europe fade?
-
Gradual offshoring: From the late 1960s, shipbuilding began shifting to functionally efficient and lower-cost Japan, followed by South Korea and China.
-
Labor and subsidy dynamics: East Asian governments heavily supported shipbuilding via state subsidies, facilitating technological modernization and economies of scale. In contrast, European shipyards, facing higher labor costs and reduced subsidies, battled to remain competitive.
-
Policy hurdles: Europe’s fragmented regulatory framework contrasted starkly with integrated state-led strategies in Japan and Korea, contributing to the erosion of its competitive position.
By 2025, Europe’s contribution dwindled to just 4% of global output, dwarfed by:
-
China – 53%
-
South Korea – 27%
-
Japan – 14%
-
United States – 0.1%
Comparing 1965 to 2025, the scale of decline is staggering: European influence has shrunk more than tenfold, with China and South Korea capitalizing on this shift through state-backed industrial strategies and cost advantages.
Asia’s Industrial Supremacy
Asia’s dominance is no fluke but the culmination of policy-led advancement, scale, and innovation in shipyard capabilities. By 2025:
-
China accounts for over half the world’s GT capacity.
-
South Korea leads in high-value vessels, especially LNG and LPG carriers.
-
Japan, while steady, trails behind its neighbors.
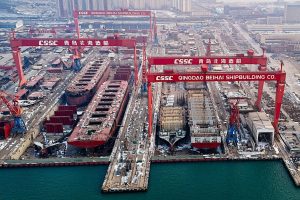
China
From minimal yard capacity in the 1970s, China emerged as a shipbuilding juggernaut by the 2000s. In early 2025, it claimed nearly 39% of new ship orders in May alone—equating to roughly 640,000 CGT, the highest share globally that month. Its strength lies in large-volume, cost-optimized production, capturing niche markets like bulk carriers and containerships.
South Korea
Though eclipsed in volume by China, South Korea remains a key player in high-value vessels. Its yards, including Hyundai Heavy Industries, Samsung Heavy, and Daewoo, excel in producing LNG/LPG carriers, VLCC oil tankers, and other complex ships. In 2024, it had around 17% of global ship orders by compensated gross tonnage (CGT), maintaining strategic importance through advanced manufacturing, technological edge, and skilled labor.
Japan
Once a titan in the era of European dominance, Japan now holds a smaller but consistent market share (~14%), focusing on specialty and niche vessels—like passenger ships, ferries, and maritime defense platforms.
–
Record Backlog Amid Declining New Orders
Clarkson Research reports that global shipbuilding output is set to reach 74.1 million GT in 2025 (up 4% from 2024), a stark contrast to the 13 million GT produced in 1965. This consistent growth reveals an industry expanding in both volume and capability.
Driven by demand for container ships, gas carriers, and car carriers—alongside a recent resurgence in cruise ship orders—the global orderbook remains robust:
-
164.4 million compensated gross tons (CGT)
-
US$511.6 billion in total value
Despite this strong orderbook, newbuilding orders dipped sharply. Through the first five months of 2025, orders fell by nearly 50% year-on-year, following what was already the highest annual volume since 2008. The downturn reflects growing geopolitical concerns—from trade tensions to shipping route uncertainty—causing shipowners to delay investments.
CXHK?¹ analysts point out that while the volume dropped, much of it stems from the extraordinary high-water mark of 2024. Some focus remains promising, particularly for containerships, even as overall pace slowed.
–
Toward a Greener, Cleaner Fleet
Decarbonization and regulatory pressure are dramatically reshaping fleet composition and port infrastructure.
-
As of mid‑2025, multilple alternative-fuel- or dual-fuel-capable platforms made up:
-
52% of the orderbook by tonnage, including 46% excluding LNG carriers.
-
-
Vessel types include:
-
~1,020 LNG dual-fuel vessels (1,397 nat’l)
-
334 methanol-capable ships
-
45 ammonia-capable ships
-
503 battery-hybrid vessels
-
This marks a steep uptick from 2024’s figures, where 50% of tonnage ordered involved alternative fuel capability—LNG again leading, with 70% of all non-LNG alternative tonnage, while methanol slipped to 14%.
Newbuild patterns confirm that the transition to low- and zero-carbon fuels is advancing fast, reshaping strategic planning from yards to ports.
–
Green Infrastructure: Ports Ready to Fuel the Transition
Global bunkering infrastructure is evolving to support greener ships:
-
275 ports now offer LNG bunkering
-
297 ports provide or plan shore power (cold ironing)
-
Only 40 ports offer or plan to offer methanol bunkering
This disparity highlights a crucial bottleneck. LNG is gaining traction, driven partly by EU incentives (under “Fit for 55”) and demonstrated demand. Methanol infrastructure, however, trails behind, constraining the adoption of methanol-fueled vessels—despite growing orders.
In alternative-fuel infrastructure, hydrogen and ammonia pilots abound but remain in nascent stages. Port systems in Singapore, Rotterdam, and Norway are leading trials as maritime regulators push for compliance with global decarbonization targets.
–
U.S. and India: Emerging but Still Small
United States
In cruisers: count ‘em. In 2025, the U.S. represents just 0.1% of shipbuilding tonnage, down from 2% in 1965. Its primary yard activity is military and defense, guided by policies like the Jones Act, which imposes restrictions on domestic shipping. High labor and operational costs, coupled with limited yard capacity, keep U.S. shipbuilding narrowly focused and commercially marginal.
India
Still emerging, India aims to break into the top-ten global shipbuilders by 2030. Yet from 2015–2024, its share amounted to just 0.1%. Clarkson notes significant investment incentives and yard expansion plans, but analysts caution that catching Asia’s heavyweights will take decades—if ever.
–
Impacts & Implications
a. Strategic Dependency
Europe’s decline—from 45% to 4%—translates into dependence on Asia for shipping logistics infrastructure—raising concerns over supply chain resilience.
b. Shift in Power & Policy
Shipyards in China and South Korea benefit from aggressive industrial policies, giving them scale and modernization advantages while regions like Europe emphasize regulation and environmental targets over volume.
c. Green Tech Divide
Asia is stepping up green-tech vessel builds. Europe, although pioneering in policy, may lag in production without coordinated industrial strategy and investment in yard modernization.
d. Geopolitical Leverage
China’s dominance in orderbook holdings and infrastructure could translate to influence over the global shipping fleet and its fuel strategies, reinforcing maritime supply chain dynamics.
–
Looking Ahead: Navigating the Waters
-
Should demand remain stable, declining orders may slow production growth, but a high backlog sustains yard activity.
-
Green fuel transition promises opportunities—but requires matching ship and port investment.
-
Europe must redefine growth, potentially focusing on niche vessels: cruise, defense, retrofit, and green shipping solutions.
-
Investment partnerships and technological collaboration may help India, the U.S., and others rebuild at-home capacity.
-
Regulatory harmonization across regions could help align environmental goals with industrial competitiveness.
What remains clear: the global shipbuilding map has firmly shifted to Asia. Europe’s decline has been vast, but renewed focus on decarbonization and green shipping offers paths for strategic reinvention.
FAQ
Q1: Why did Europe lose shipbuilding dominance?
Answer: European shipyards were outpaced by state‑subsidized, lower‑cost, technologically advanced Asian yards. Coupled with regulatory fragmentation and rising labor costs, Europe lost competitiveness.
Q2: How fast is green technology adoption in new ships?
Answer: About 52% of ships in the global orderbook are alternative-fuel capable (46% excluding LNG). LNG leads, but methanol, ammonia, hydrogen, and hybrid technologies are gaining momentum.
Q3: What does the sharp decline in new orders mean?
Answer: Despite falling orders (−50% year‑on‑year), these occurred after the record year of 2024. A strong backlog cushions shipyards, suggesting a timing gap rather than a structural collapse.
Q4: Could India challenge Asian shipbuilding giants?
Answer: India is investing in shipbuilding but remains tiny (≈0.1%). With current government goals, it may join the top 10 by 2030, but catching up to China and Korea is a long-term challenge.
Q5: Will methanol become a major bunker fuel soon?
Answer: Adoption is growing, but only 40 ports offer or plan methanol bunkering compared to 275 for LNG. Its future depends on port investment and scaling fuel supply chains.
Also, read the following articles:
From West to East: The Global Export Power Shift (1948–2024)
Costruzioni navali, in 60 anni l’Europa è passata dal 45% al 4% della quota mondiale
References
- ShipMag: https://www.shipmag.it/costruzioni-navali-in-60-anni-leuropa-e-passata-dal-45-al-4-della-quota-mondiale/
-
Clarkson Research: Nor‑Shipping 2025 forecasts and market outlook
-
Clarkson Research: global orderbook data and production history
-
Clarksons Green Technology Tracker (2024, 2025)
-
SteelOrbis: China’s share of recent ship orders (May 2025)
-
WorldCargo News: LNG dominance in fuel orders
-
Maritime Gateway: shipbuilding and bunkering stats
-
Asia Fund Managers: South Korea’s shipbuilding analysis
-
DNV / Seatrade Maritime: alternative-fuel vessel developments