
The Rise of China in Global Trade (2000–2024)
📈 The Shift in Global Economic Power
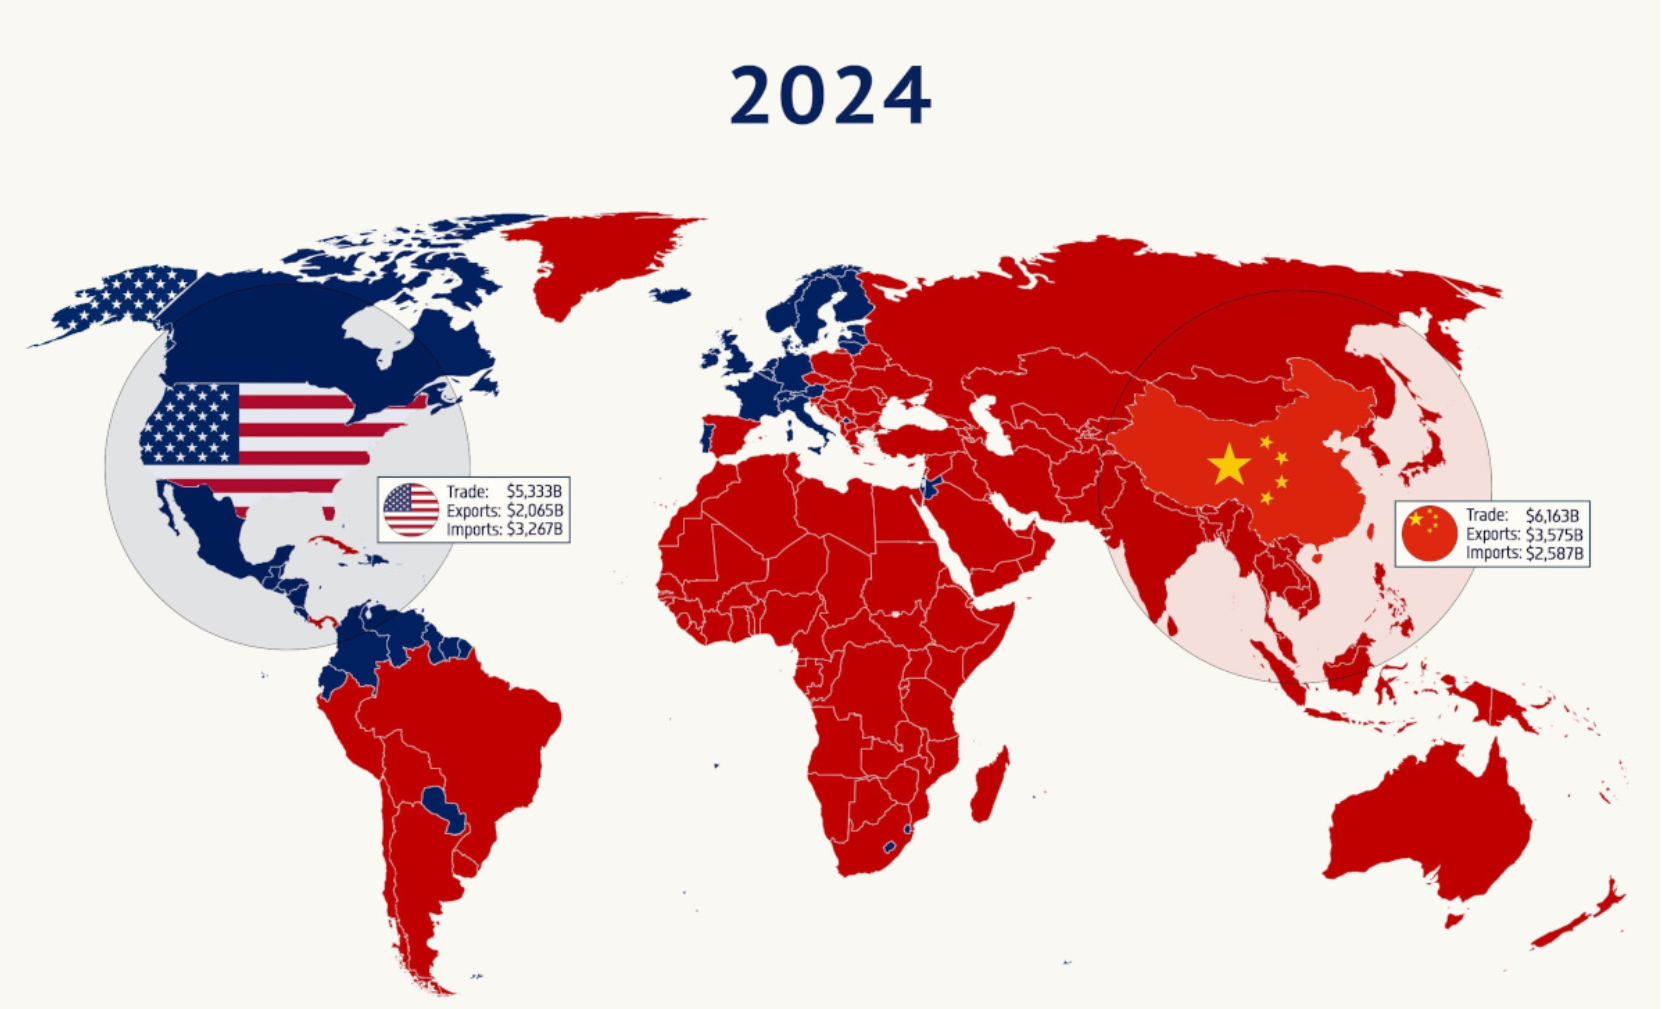
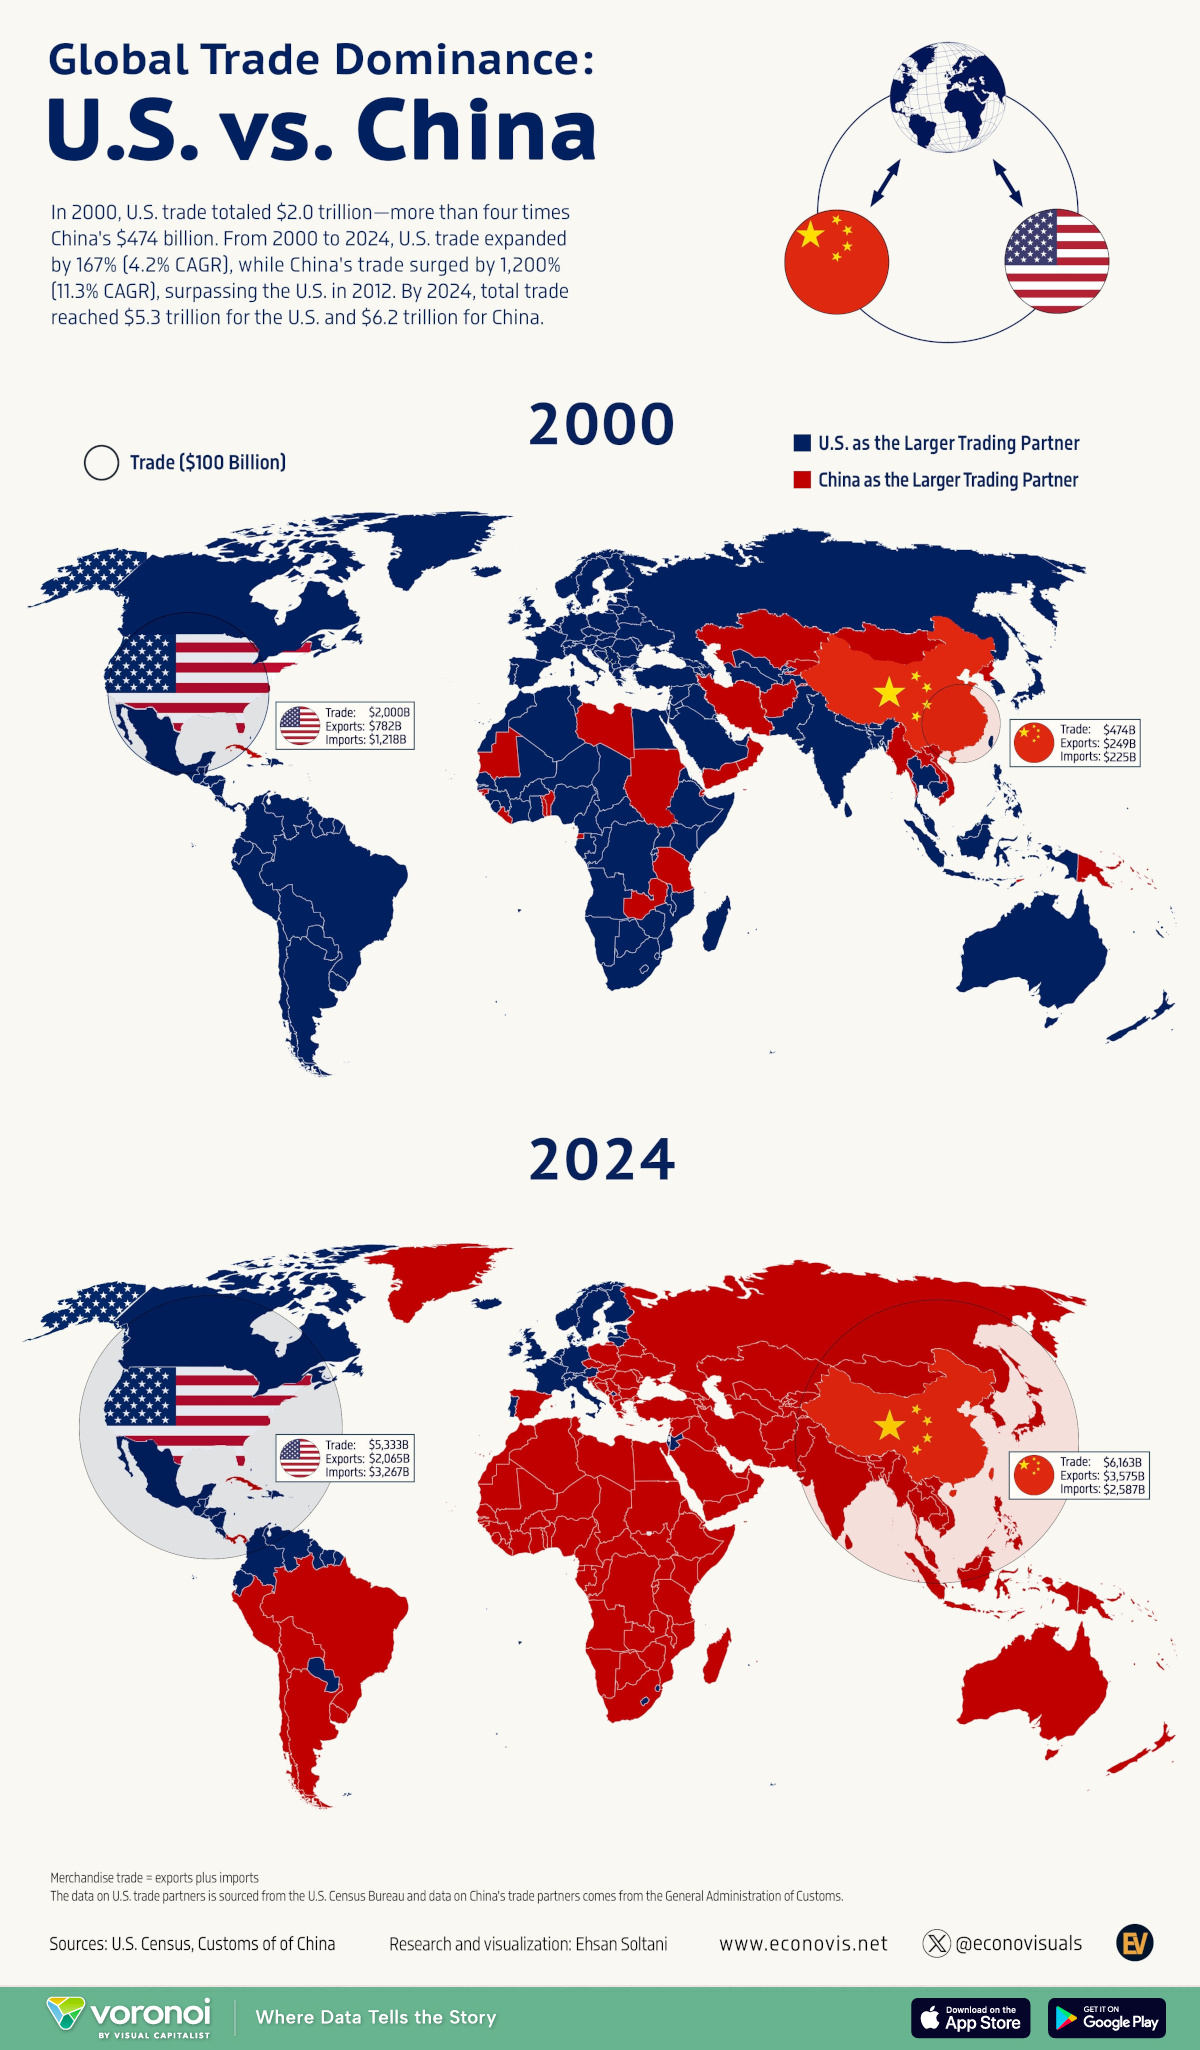
In the year 2000, the United States stood unchallenged as the world’s trade superpower, commanding a total trade value of $2.0 trillion—over four times greater than China’s $474 billion. However, fast-forward to 2024, and the global trade map tells a very different story. China now leads the world in trade, with a staggering $6.2 trillion in total trade volume, surpassing the U.S.’s $5.3 trillion.
This shift marks a historic economic power transition from the West to Asia, with China emerging as the largest trading partner for countries across Asia, Africa, Eastern Europe, South America, and Oceania.
🌍 Visual Proof: The Changing World Map of Trade
The images provided clearly illustrate this transition:
-
In 2000, most countries had the U.S. as their top trade partner (shown in blue).
-
By 2024, that dominance had dramatically reversed, with China (shown in red) becoming the main trading partner for the majority of the globe.
Only a few regions—only North America, and parts of Europe – still lean more heavily toward the U.S. in trade !!
Sources: U.S. Census Bureau, China Customs, VisualCapitalist, Econovisuals, https://www.census.gov/foreign-trade/data/index.htmlhttp://english.customs.gov.cn/
Visualizations by: Ehsan Soltani | econovis.net
📊 Key Figures: US vs China Trade (2000 vs 2024)
| Year | Country | Total Trade | Exports | Imports |
|---|---|---|---|---|
| 2000 | USA | $2.0 Trillion | $728B | $1,272B |
| 2000 | China | $474 Billion | $249B | $225B |
| 2024 | USA | $5.3 Trillion | $2,065B | $3,267B |
| 2024 | China | $6.2 Trillion | $3,575B | $2,587B |
Growth Over 24 Years:
-
U.S. trade grew 167% (CAGR: 4.2%)
-
China’s trade skyrocketed by 1,200% (CAGR: 11.3%)
China overtook the U.S. in global trade dominance by 2012, and the lead has only widened since.
🌐 Who Trades More with Whom?
-
China is now the top trade partner for nearly every country in Asia, Africa, South America, and much of Eastern Europe.
-
The U.S. maintains strong trade ties mostly with Canada, Mexico, Western Europe, and select parts of the Caribbean and Pacific.
This reshaping of global trade networks also reflects the changing supply chains, resource demands, and manufacturing hubs.
🔍 What Drives China’s Trade Dominance?
China’s strategy has been clear and consistent:
-
Imports: Fuels, minerals, and food from emerging markets
-
Exports: Electronics, machinery, textiles, and vehicles
Meanwhile, the U.S. has focused more on services and high-tech products but lost manufacturing ground.
🌏 What’s Next? Future Trade Trends
-
U.S. & Allies: Expected to deepen trade ties with Europe, India, and North Africa.
-
China: Will continue expanding its trade footprint in emerging markets through initiatives like the Belt and Road.
Global supply chains will keep shifting toward Asia, especially as China boosts investment in infrastructure, ports, and digital trade corridors.
🧠 Why This Matters
This global trade shift reflects more than just numbers:
-
It signifies China’s geopolitical rise.
-
It challenges the traditional dominance of Western economies.
-
It impacts everything from foreign policy to supply chain security, climate strategy, and technology access.
🏁 Conclusion
From a marginal player in 2000 to the global trade leader in 2024, China’s meteoric rise has permanently altered the balance of economic power. As Asia becomes the new center of global trade, businesses, governments, and investors must rethink their strategies in a China-dominated landscape.
Thank you.