
DNV Energy Transition Outlook 2026
Report summary
Executive summary
DNV’s Energy Transition Outlook 2026 presents a most-likely forecast of how the global energy system may evolve to 2060. It is a forecast of expected developments under the policies, economics, technologies, and behaviour assessed by DNV, not a pathway designed to meet a climate target. Its central conclusion is that the transition is continuing at scale, driven increasingly by electrification and the cost competitiveness of renewable power, but it is not progressing quickly enough to meet the Paris Agreement’s temperature goals. DNV projects that total human-caused CO2 emissions will reach net zero only in 2098, corresponding to about 2.3°C of warming by 2100.
The transition is also changing its motivation and geography. Energy security, resilience, industrial competitiveness, and control over supply chains now sit alongside decarbonization as policy priorities. Energy-importing economies are seeking to reduce exposure to imported fuels by building domestic renewable and nuclear capacity, improving efficiency, and electrifying demand. Exporting economies continue to develop oil and gas resources while also expanding renewable electricity, often to serve domestic demand or new industries. The result is not a uniform global transition but a set of regional pathways shaped by resource endowments, income, industrial structure, and political priorities.
Electricity is the main engine of change. DNV expects final electricity demand to double by 2060. Solar and wind generation expand about ten-fold and provide 77% of electricity by then. Electrification allows useful energy services to grow while reducing the amount of energy wasted in combustion. It also shifts the main infrastructure challenge from fuel supply toward generation, transmission and distribution grids, storage, and flexible demand. The report argues that adding renewable generation alone is insufficient: systems must be designed to integrate variable supply, connect new loads, and maintain reliability and affordability.
The forecast nevertheless includes continued fossil-fuel use for decades. Oil demand is expected to peak in 2029, gas in 2034, while coal use and emissions have already plateaued around 2024–2025. Fossil fuels remain important to transport, industry, heating, and power, though their share of primary energy declines from about 80% historically to 51% in 2050 and 40% in energy-importing regions. Hard-to-electrify activities, including aviation, maritime transport, and high-temperature industrial processes, decarbonize more slowly because alternatives such as sustainable biofuels, hydrogen-based fuels, and carbon capture are costly, supply-constrained, or not yet deployed at scale.
The economic case for the transition is strong over time, but the capital challenge is immediate. Energy expenditure rises during the build-out period as societies maintain existing infrastructure while financing new low-carbon systems. DNV estimates a 17% increase in annual global energy expenditure by 2060, alongside 96% growth in global GDP. Investment in electricity infrastructure, grids, and storage is set to rise sharply, while the cost of capital remains a major determinant of which technologies can scale. Mature technologies such as solar and wind attract cheaper financing than emerging options such as hydrogen and carbon capture, utilization, and storage (CCUS). Lowering financing costs and managing policy risk are therefore central transition tools.
1. The report’s starting point and forecasting approach
The 2026 Outlook is the tenth edition of DNV’s annual forecast. It reviews the accuracy of earlier expectations and updates its view of technology costs, policies, geopolitical shifts, regional industry, and energy demand. The report emphasizes that forecasts should be judged against real-world developments rather than aspirations. Over the past decade, solar, wind, and batteries have advanced rapidly, while grids, hard-to-abate sectors, and some clean fuels have progressed more slowly than needed. The overall transition remains consequential by historical standards, but its speed and geographic distribution have changed.
DNV uses a system-dynamics model to link energy demand, supply, technology choices, prices, investment, policy, and emissions. The model is intended to represent feedbacks: for example, technology costs affect deployment, deployment affects costs, and policy or geopolitical events influence investment and supply chains. This approach matters because an energy transition is not a simple replacement of one fuel with another. New electricity demand, infrastructure bottlenecks, financing conditions, and changing industrial patterns can reinforce or constrain one another.
The report’s 2026 updates reflect a more fragmented geopolitical environment, the Iran war and disruption risks, and the rapid build-out of data centres and artificial-intelligence workloads. DNV adjusts assumptions about economic growth, manufacturing footprints, regional technology costs, supply-chain development, and resource priorities. The report also discusses the limits of prediction: its results depend on assumptions about economic development, technology performance, policy implementation, and behavioural change. Its central forecast should therefore be read as a coherent view of what DNV considers most likely, not as a guarantee or a recommendation.
2. Geopolitics, energy security, and policy change
The Iran war and disruption to energy supply routes reinforce the vulnerability of economies dependent on imported fuels. In the short term, supply shocks can raise prices, encourage emergency production, and lead governments to use reserves or subsidies. DNV expects the immediate oil shock to ease over time, but the disruption also contributes to longer-term demand destruction: consumers and businesses respond to higher or uncertain prices by improving efficiency, switching technologies, and reducing exposure to oil. In the report’s view, such shocks strengthen the case for domestic clean energy even when they temporarily increase fossil-fuel production elsewhere.
Energy security is not only about replacing imported oil and gas. Governments are also concerned about dependence on concentrated supply chains for batteries, solar equipment, critical minerals, and other technologies. As a result, localization rules, domestic manufacturing support, supplier diversification, and trade measures are becoming more common. These policies may raise near-term costs compared with sourcing from the lowest-cost global supplier, but are intended to build resilience and domestic value. They also complicate the economics and geography of projects.
Climate policy is becoming more differentiated. Many high-income economies and China continue to support system-wide decarbonization, including measures that address industrial emissions and trade exposure. Exporting economies and some major producers retain support for fossil infrastructure. Middle- and lower-income regions often prioritize affordable energy, access, economic growth, and infrastructure expansion, while deploying renewables where their economics are attractive. This creates a policy landscape in which climate action is increasingly tied to energy sovereignty, industrial strategy, air quality, and competitiveness rather than to emissions targets alone.
Policy design can either accelerate or slow structural change. Carbon prices, clean-energy standards, efficiency requirements, public procurement, and support for research and infrastructure can help new technologies scale. Conversely, broad price controls and subsidies introduced to shield consumers from energy shocks can weaken incentives to conserve energy and improve efficiency. DNV’s discussion stresses that emergency support should be designed with clear limits or sunset provisions. The central policy challenge is to protect households and businesses from volatility without undermining the investment signals that make the energy system less exposed to future shocks.
3. Global energy demand and efficiency
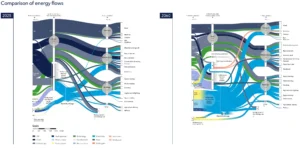
Demand for energy services continues to rise as population, incomes, urbanization, and economic activity grow. DNV projects that useful energy demand will increase by 23% from 2026 to 2040 and by a further 10% to 2050. Buildings account for more than half of the additional useful-energy demand. At the same time, final energy demand grows much more slowly: it rises only about 8% before plateauing in the 2030s and then begins to decline. The difference is explained primarily by efficiency and electrification.
Electric motors, heat pumps, and batteries deliver more useful service from each unit of energy than combustion technologies. Electric vehicles convert a larger share of energy into motion than internal-combustion vehicles, while heat pumps move heat instead of generating it through fuel combustion. As these technologies spread, consumers can receive more transport, heating, and cooling services even as the total energy supplied to end users stabilizes or falls. DNV describes this as a shift from focusing only on energy inputs to considering the useful service delivered and the losses avoided.
Transport demand grows as people and goods travel more, yet the sector’s final energy use is expected to decline as electrification cuts losses, especially in road transport. The global vehicle fleet becomes increasingly electric, and electric vehicles account for 84% of the fleet by 2060. Aviation and shipping are harder to electrify directly because batteries are unsuitable for most long-distance operations and because vessels and aircraft have long asset lives. Efficiency measures and lower-carbon fuels therefore remain important in these sectors.
Buildings are the only major end-use sector whose final energy demand is higher in 2050 than today. Growth is driven by new data centres and AI (38% of the increase identified by DNV) and by additional space cooling in other buildings (35%). Greater population and income increase floor area and cooling needs, while climate warming adds to cooling demand. Heat pumps and building improvements offset some of this growth, and the report expects the global average efficiency of buildings to exceed 100% in its accounting measure because heat pumps deliver more heat than the energy they consume.
Manufacturing’s energy use reflects both economic growth and the difficulty of replacing fossil fuels in industrial heat. Electrification expands where technically and economically practical, but high-temperature processes, chemical feedstocks, and process emissions remain challenging. The main conclusion is that demand-side efficiency is an essential supply resource: avoiding waste reduces the generation, grid, storage, fuel, and investment required to deliver a given level of economic activity.
4. Electricity becomes the centre of the energy system
Global electricity demand doubles over the forecast period, much faster than total final energy demand. Buildings and transport drive much of the increase, alongside data centres, AI, and hydrogen production. Electricity use in buildings, excluding data centres, grows by 75% to 2060. Manufacturing electricity demand rises by 52%, although its share of overall electricity demand falls from 42% today to 31% in 2060 as other sectors electrify faster. The global vehicle fleet becomes 84% electric by 2060. Space-cooling demand more than doubles.
Data centres are a particularly important source of new concentrated demand. They currently account for about 1.2% of global electricity consumption, mostly for non-AI activity. By 2060, AI is expected to account for 77% of data-centre electricity use, bringing data centres to 10% of total global electricity demand. This growth can strain local grids and require costly upgrades. DNV presents data centres as an example of a broader infrastructure problem: grid constraints have accumulated through decades of underinvestment and need to be addressed regardless of the precise pace of AI growth.
Solar and wind are the leading sources of new generation because their costs and deployment rates are increasingly competitive. DNV forecasts that their combined output will grow about ten-fold and reach 77% of global electricity generation by 2060. Renewable generation does not remove the need for other resources. Nuclear grows in many regions, particularly after 2040; hydropower continues to provide electricity and flexibility; geothermal expands as enhanced systems develop; and fossil-fuel plants remain part of the supply mix, increasingly operating at lower utilization or with carbon capture where economics and policy support it.
The electricity system must manage variable generation across time and location. Transmission and distribution expansion, storage, digital controls, demand response, and better market design become essential. Batteries, including lithium-ion systems, can shift electricity across hours and support balancing. Flexible loads such as electric vehicles, heat pumps, and buildings can alter consumption in response to system needs. Rooftop solar, household batteries, and electric vehicles also turn consumers into “prosumers” who both use and supply electricity. Aggregated through digital systems, distributed assets can provide services similar to virtual power plants.
System integration has to be planned alongside new generating capacity. Grid connections, permitting, skilled labour, equipment availability, and access to finance can delay projects. Market designs must reward not only low-cost energy but also capacity, flexibility, and reliability. DNV’s outlook assumes unprecedented investment in grids and related infrastructure; if that investment does not occur, electrification and renewable integration could be slower than the forecast.
5. Oil, natural gas, coal, and carbon capture
Fossil fuels remain a large part of the energy system throughout the forecast, but their relative importance declines. Oil use and emissions are forecast to peak in 2029. The main factor is the expansion of electric vehicles; global EV sales exceed half of new vehicle sales by 2035. Short-term supply disruptions do not reverse this structural trend. Instead, higher prices and supply insecurity can hasten efficiency improvements and substitution, reducing long-term oil demand.
The Middle East remains a major oil-producing region, but DNV expects its share of global oil production to be smaller than previous forecasts anticipated. The 2026 report projects that the region will supply around 40% of global oil production in 2050, compared with 50% in DNV’s 2025 projection. This reflects revised assumptions about supply disruptions and production elsewhere. Oil demand also changes by sector: road transport declines with electrification, while aviation, shipping, petrochemicals, and other uses retain demand longer.
Natural gas continues to play a transitional and balancing role. Gas demand and emissions peak in 2034 at approximately 9.2 Gt of CO2 emissions, then decline. In the 2020s and early 2030s, gas can displace coal in Asian power generation and heating, reducing total emissions where it replaces more carbon-intensive coal. Later, electrified heating and renewable electricity reduce gas consumption. DNV projects gas-related emissions to fall 34% from 2025 levels by 2060. Gas infrastructure may remain in service even as utilization declines, creating risks of underused assets and more complex choices about retirement or adaptation.
Coal use and emissions have plateaued around 2024–2025. Wind and solar additions are increasingly sufficient to meet electricity demand growth in the largest coal-consuming markets, though regional patterns vary and coal remains in the system for decades. Coal generation may still respond to supply shortages or high gas prices. This reinforces the report’s point that security of supply requires managed decline and reliable alternatives, rather than assuming that existing fossil infrastructure can be removed immediately.
Carbon capture and storage is expected to grow, but its contribution is constrained by high costs, infrastructure requirements, and the need to develop transport and storage networks. The project pipeline is strong, with power generation and industry among the potential deployment areas. CCUS may help reduce emissions from sectors where direct electrification or fuel switching is difficult, but the forecast does not treat it as a rapid substitute for broad emissions reduction. Its contribution depends on project economics, regulatory support, public acceptance, and access to suitable storage.
6. Hydrogen, bioenergy, and direct heat
Clean molecules are needed where electricity is difficult to use directly, but DNV’s forecast is more cautious about their pace of expansion than early expectations for a rapid hydrogen economy. Hydrogen can support industrial processes, produce derivatives such as ammonia and synthetic fuels, and potentially provide energy for shipping, aviation, and other hard-to-electrify activities. However, its deployment is held back by conversion losses, high production and transport costs, infrastructure gaps, safety concerns, and uncertainty about long-term demand.
Renewable hydrogen depends on electrolyser deployment and access to abundant low-cost electricity. Producing hydrogen from electricity and then converting or transporting it for end use requires more energy than direct electrification. As a result, hydrogen is most valuable in applications where direct electricity is impractical or where hydrogen is already a feedstock. DNV notes that safety confidence, regulatory certainty, and viable business cases must develop in parallel. Without those elements, ambitious policy targets may not translate into actual projects.
Bioenergy can provide liquid and gaseous fuels for sectors that are difficult to electrify, but sustainable feedstocks are limited and compete with other land and material uses. Biofuels may reduce emissions in aviation and shipping, where battery power is limited, while biomethane can substitute for fossil gas in some applications. The volume available depends on sustainable resource supply, conversion technologies, and competing uses. Bioenergy with carbon capture can create net removals when captured biogenic carbon exceeds emissions across the supply chain, but DNV expects these volumes to be modest relative to fossil-fuel emissions.
Direct heat technologies and industrial electrification improve over the forecast, but high-temperature process heat changes slowly. Electric boilers, heat pumps, and other technologies can serve lower-temperature needs, while new solutions for high-temperature applications enter commercial use later. This slow transition contributes to persistent industrial emissions and increases the importance of efficiency, material substitution, process innovation, and targeted carbon capture.
For maritime transport, the outlook points to a prolonged period of fuel diversity and uncertainty. Efficiency improvements, operational optimization, and electrification on shorter routes can reduce demand, but most long-distance shipping will continue to require energy-dense fuels. Biofuels and hydrogen-derived fuels could contribute, although supply, cost, safety, and bunkering infrastructure must be resolved. The report also identifies regulatory uncertainty: the IMO’s proposed global fuel standard and emissions-pricing mechanism were postponed, weakening near-term confidence in the investment framework for low- and zero-carbon fuels. That delay does not remove the need to decarbonize shipping; it makes policy signals and coordinated infrastructure more important.
7. Policy tools and regional differences
The report identifies a broad policy toolbox rather than a single measure that can deliver the transition. Targets can set direction, while standards and mandates create demand for cleaner technologies. Carbon pricing can influence operating decisions and investment, though its effectiveness depends on coverage, price levels, and political durability. Public finance and guarantees can lower risks for new infrastructure; research support can improve emerging technologies; and grid planning, permitting reform, and workforce development can remove practical bottlenecks.
Policy is shaped by national circumstances. Energy importers are motivated by energy sovereignty and price stability. Exporters seek to preserve revenues and market access while developing domestic industries. High-income economies are more likely to support emissions reduction across the whole system, including sectors exposed to trade. Lower-income economies must balance emissions reduction with energy access, affordability, and development. In these regions, the falling cost of solar and wind creates opportunities to expand electricity access without building all future capacity around fossil fuels.
Carbon pricing continues to expand in some jurisdictions and is increasingly linked to trade. Border adjustment mechanisms can encourage trading partners to measure and reduce embedded emissions, but they also raise concerns about fairness and competitiveness. The Outlook emphasizes that carbon pricing is only one part of the policy picture. Its effect depends on the alternatives available to firms, the cost of capital, public infrastructure, and whether governments provide credible long-term rules.
The gap between mature and emerging technologies is widening. Solar, wind, batteries, and electric vehicles are increasingly competitive and can often scale with less subsidy. Hydrogen and CCUS still depend more heavily on public support, infrastructure investment, and policy certainty. DNV argues that policymakers need to distinguish between support that helps a technology become commercially viable and support that sustains activity without creating a durable emissions benefit. Clear goals, consistent rules, and evaluation of outcomes are important for avoiding stranded investments.
8. Finance and investment
The 2020s and early 2030s are the most expenditure-intensive phase of the energy transition. Governments, companies, and households must maintain and manage down ageing fossil systems while constructing renewable generation, grids, storage, charging networks, and other electrified infrastructure. Overall energy expenditure rises during this build-out phase before the lower operating costs of renewable and efficient systems become more visible.
DNV estimates that annual global energy expenditure increases by 17% by 2060, while global GDP rises by 96%. This implies that energy costs become a smaller share of economic output over time, even though the transition requires substantial capital. Investment shifts from fuel supply toward electricity infrastructure. Solar becomes the largest destination for energy-sector investment, while grids and storage attract growing capital as demand becomes more electrified and variable.
The cost of capital determines which projects can proceed and how quickly. Mature renewables generally benefit from lower financing costs than fossil generation, while emerging technologies face higher premiums because of technical, commercial, and policy uncertainty. The report’s estimates show continued regional differences in financing conditions, with higher costs slowing deployment in many lower-income economies. Reducing risk through credible regulation, stable revenue mechanisms, guarantees, and international finance could accelerate deployment at lower overall cost.
Households are also important investors and beneficiaries. Decisions about vehicles, heating systems, insulation, rooftop solar, and batteries are shaped by upfront costs, access to credit, energy prices, and policy support. Because many consumers cannot finance efficient equipment even when it reduces lifetime costs, the transition depends partly on financing models that distribute costs over time. Targeted household support can improve access while avoiding broad subsidies that weaken price signals.
9. Emissions and climate consequences
DNV estimates that energy-related CO2 emissions have likely peaked within the last 24 months and will fall by 65% to 12 Gt annually in 2060. Total anthropogenic CO2 emissions, including energy use, industrial processes, and land-use change, likely peaked in 2024 at about 43 Gt. Despite the decline, the report projects net zero only in 2098 and warming of approximately 2.3°C by 2100.
The emissions trajectory reflects uneven progress. Power-sector emissions fall fastest, declining 82% as coal and gas generation is replaced by renewables, nuclear, and some captured fossil generation. Transport emissions fall by 56%, mainly because of road-vehicle electrification. Manufacturing energy emissions decline more slowly because high-temperature heat and process emissions are difficult to eliminate. Buildings achieve a smaller reduction, around 29%, because efficiency and heat pumps are partly offset by growth in floor area, cooling demand, and data-centre loads.
By 2060, transport is projected to be the largest emitting sector, at about 3.9 Gt of CO2, followed by power at 2.8 Gt, manufacturing energy use at 2.5 Gt, and buildings at 1.9 Gt. Process emissions fall by only 14% between 2025 and 2060, from about 3.4 to 2.9 Gt. Cement production illustrates the challenge: emissions are released by the chemical reaction that produces clinker, not only by the fuel used to heat the kiln. Electrification alone therefore cannot remove the full process-emissions burden.
The carbon-budget implications are severe. DNV estimates that the remaining 1.5°C budget is exhausted in 2029 and the 2°C budget in 2052. Cumulative emissions exceed the 2°C budget by around 420 Gt by 2100. Direct air capture and other removals help determine when net zero is reached but are not large enough to prevent the projected overshoot. Direct air capture reaches about 0.4 Gt annually in 2060 and 3 Gt by 2100 in the forecast. The report’s conclusion is that emissions fall substantially, but not at the speed required to remain within the remaining carbon budgets.
10. Regional outlook
Regional trajectories differ substantially in timing and depth. Europe, North East Eurasia, North America, and OECD Pacific reached peak emissions between 1980 and 2013. Greater China is expected to peak around 2026, the Indian Subcontinent in 2032, South East Asia in 2035, the Middle East and North Africa in 2037, and Sub-Saharan Africa in 2050. DNV expects emissions to fall from 2025 to 2060 in nine of the ten regions; Sub-Saharan Africa remains roughly flat as demand for energy services grows.
Greater China is expected to reduce emissions by 79% from 2025 to 2060, supported by electrification, renewable deployment, and a likely emissions peak in the mid-2020s. Europe’s emissions decline most steeply, by 92%, while North America falls 78% and OECD Pacific 86%. North East Eurasia’s decline is more limited at 31%. Latin America falls 40%. The Indian Subcontinent declines 27%, South East Asia 35%, and the Middle East and North Africa 22%. The report’s figures underline that emerging and exporting regions account for a larger share of residual emissions in 2060 than they do today.
Differences in industrial structure, economic growth, energy access, and fossil-fuel exports help explain the pattern. Regions with large cement, steel, and chemical industries retain process emissions. Export-dependent economies see emissions move with extraction and production as well as with domestic demand. Regions where electricity demand grows rapidly need much more clean generation simply to prevent emissions from rising. Investment costs and infrastructure access also affect how quickly these regions can electrify and adopt low-carbon alternatives.
11. Main implications and conclusions
The DNV Energy Transition Outlook 2026 describes an energy transition that is real, broad, and increasingly driven by market economics, yet insufficient for climate goals under its most-likely assumptions. The decisive shift is from fuel combustion toward electricity, efficiency, and renewable generation. It brings benefits for energy security and productivity, but it also creates an urgent need to modernize grids, build storage, and coordinate new loads with local infrastructure.
For decision-makers, the near-term priority is systems integration. Planning must link renewable generation with transmission, distribution, storage, flexible demand, market design, and workforce capacity. Investment in electricity infrastructure must keep pace with the electrification of transport, buildings, manufacturing, and data centres. Energy security also requires attention to the fossil infrastructure and trade routes that remain necessary during a managed transition.
For hard-to-abate sectors, including shipping, aviation, steel, cement, and chemicals, the report signals that electrification alone will not suffice. They need more efficient operations, material and process innovation, credible long-term policy, and scalable low-carbon fuels or carbon-management solutions. Hydrogen and bioenergy can play targeted roles, but their deployment will depend on cost, sustainable supply, safety, and infrastructure. In shipping, uncertainty around international rules makes long-term fuel and vessel investment more difficult; clear, coordinated standards and pricing mechanisms would improve confidence.
For policymakers, the report highlights the value of aligning climate measures with energy independence, affordability, domestic industry, and resilience. Predictable policy can reduce financing costs, support infrastructure, and guide private capital. Targeted assistance can protect households during price shocks while preserving incentives for efficiency. Regional policies need to reflect different resources and development priorities, while international cooperation remains important for supply chains, trade, finance, and emissions standards.
The Outlook’s central warning is that progress and adequacy are different. Emissions can peak and decline, renewable generation can grow rapidly, and energy efficiency can improve while the world still exceeds its carbon budget. The forecast’s 2.3°C warming outcome underscores the gap between current expected action and climate objectives. Faster deployment of mature technologies, stronger grids, lower financing costs, and credible pathways for emissions-intensive sectors would improve the trajectory, but the report does not assume these changes will happen at the scale needed automatically.
Source note
This summary condenses DNV, Energy Transition Outlook 2026: A global and regional forecast to 2060. Figures and statements reflect the report’s 2026 forecast and assumptions. In particular, geopolitical developments and policy references are time-sensitive and should be interpreted in the context of the report’s publication period.